
What Is the Centre of Pressure, How Is It Calculated, and Why Does It Move?
The HoofFlix Team
Questions from readers about the CoP data in our previous articles deserve a proper answer. This one goes into the methodology, the literature, the dataset, the verification, and what the research actually shows about how centre of pressure varies across the stance phase. If you have ever wondered what Duckett’s Dot really represents — or whether it does what people claim — this is the article.
Several readers responded to our previous articles on heel height and DDFT mechanics with questions about the centre of pressure calculations we cited. Those questions are good ones, and they deserve a detailed answer rather than a passing reference to a footnote. Here they are, addressed one by one.
Before we start, a note on sourcing. The primary dataset underpinning the CoP values cited in our articles is the Caldwell PhD thesis (University of Liverpool, 2016/2017), which is the most comprehensive proportional mapping study of the equine hoof currently in the peer-reviewed literature.³ The dynamic force plate methodology it draws on comes principally from Wilson et al. (1998)¹ and Van Heel et al. (2004, 2005, 2006).²,⁴,⁵ Where those sources diverge or complement each other, this article says so explicitly.
What is the centre of pressure, and where does it sit?
The centre of pressure is the single point through which the net ground reaction force acts during stance. It is not a fixed anatomical point. It is a calculated resultant — a mathematical summary of the entire distributed pressure pattern between the hoof and the ground at any given instant. If you had ten thousand tiny force sensors under the hoof, you could read the pressure at every point and calculate the weighted centroid of all those readings. That centroid is the CoP.
In the sagittal plane, the CoP sits approximately 9.5 mm palmar to the apex of the trimmed frog at mid-stance in a well-balanced foot. This position was identified by Duckett as an external landmark — now known as Duckett’s Dot — and subsequently verified by force plate measurement.¹ The internal anatomical correlate of this position is the zone of the DDFT insertion on the basal surface of P3. That correspondence is not a coincidence: the geometry of the foot positions the ground’s resultant upward push approximately beneath the point where the deep digital flexor tendon anchors to the coffin bone.
This is a sagittal-plane measurement only. Duckett’s Dot marks where the CoP sits along the front-to-back axis of the foot. It says nothing about mediolateral position. Those are two separate questions requiring separate analyses.
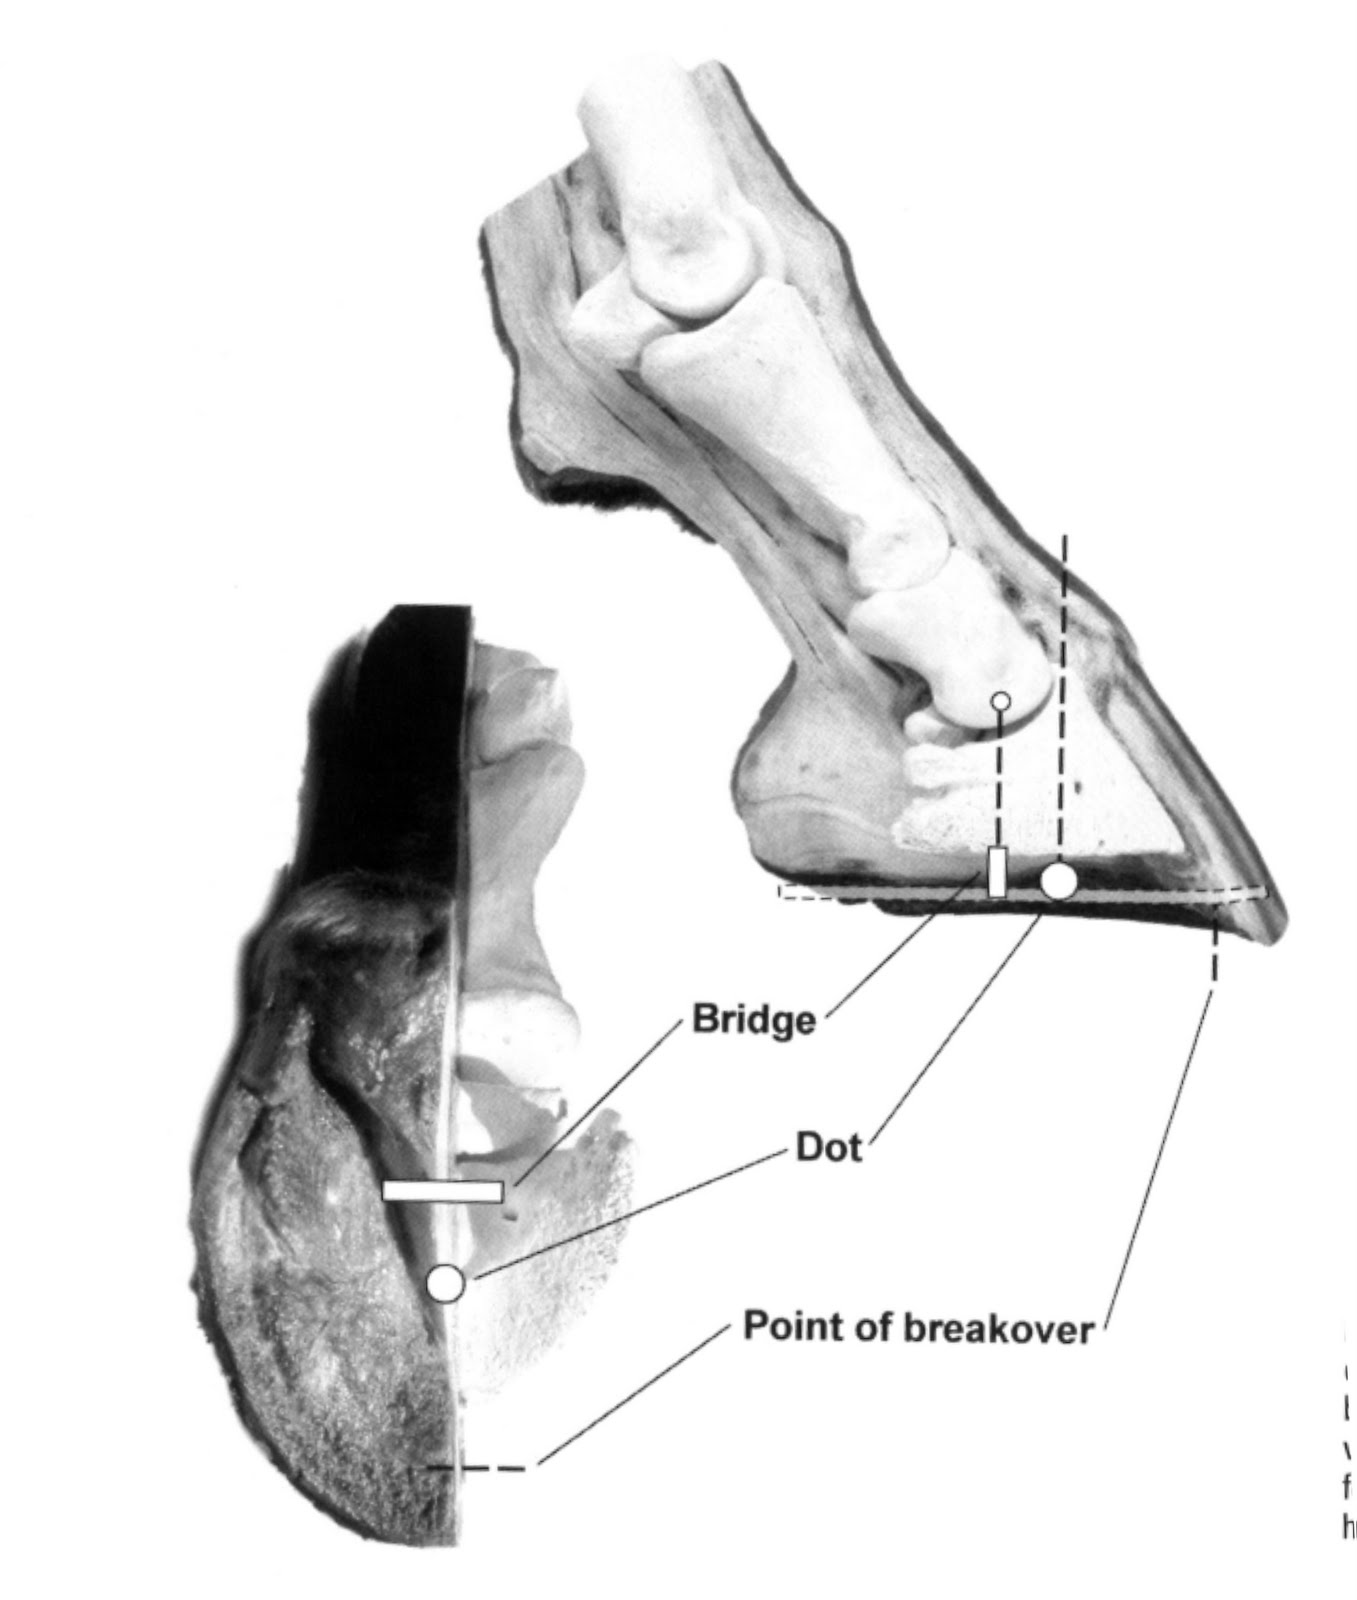
Ducketts’ 1990 points of reference the DOT and Bridge . photo Fran Jurga
How is it calculated — and where does the data come from?
The CoP is not calculated from anatomical photographs or external landmarks alone. It is measured directly, using either a force plate or a pressure plate, both of which record the spatial distribution of ground reaction force under the hoof in real time throughout the stance phase.
A force plate is a rigid instrumented surface embedded in the ground. It measures the three components of ground reaction force — vertical, fore-aft longitudinal, and mediolateral transverse — and their point of application as functions of time throughout the stance phase. The CoP at any instant is calculated from the ratio of the moments and forces acting on the plate: specifically, it is the point at which the net vertical force would need to act to produce the observed moments about each axis. No assumptions about hoof morphology are required. The plate measures force distribution directly.
A pressure plate records the spatial distribution of normal (perpendicular) force across its surface at high temporal resolution, typically 100 to 300 Hz. It produces a map of pressure across the contact area at each time step, and the CoP is calculated as the pressure-weighted centroid of that map at each instant. Pressure plates give more spatial detail than force plates but less precision on shear forces. For CoP position in the sagittal plane, the two methods agree closely.²
The Caldwell PhD work used both external landmark measurement on 49 cadaver forelimb specimens (standardised trim protocol, pressure mat verification) and clinical data from 155 feet of horses presenting for MRI with digit-localised lameness. The cadaver specimens allowed precise internal anatomical verification because the limbs could be dissected after measurement — establishing whether the external landmarks corresponded to the internal structures they were claimed to represent.³
Which parameters were selected and why?
The Caldwell study selected parameters specifically to address the problem of scale variation across horses. A parameter expressed in millimetres is correct for one horse and wrong for every other. The study therefore expresses all measurements as proportions of a denominator that scales with the individual foot.
Two denominators are used, and the distinction between them matters.
The sagittal length (SL) is the distance from the most palmar aspect of the heel bulb to the trimmed dorsal toe wall. It is the primary denominator for trim validation measures: CoP/SL, CoR/SL, and breakover distance/SL. It captures the full sagittal extent of the hoof as the pressure mat records it, including the heel bulb projection.
The bearing border length (BBL) is the distance from the dorsal toe wall to the heel buttress along the bearing surface. It is used for the three Duckett hoof balance indicators: DHWL/BBL, DDTBB-CoR/BBL, and CoP-Heel/BBL. It is always shorter than SL because it excludes the heel bulb projection. Confusing the two denominators produces numerical values that look similar but are geometrically different — a common source of error in secondary literature.³
The key proportional parameters established by the Caldwell work are:
CoP/SL (from heel bulb): 0.64–0.65 in post-trim cadaver controls. The CoP sits approximately 64 to 65 percent of the way from the heel bulb toward the toe — in the dorsal two-thirds of the sagittal length. In the MRI lameness group this was 0.67–0.68, indicating dorsal migration of the CoP with disease.
CoR/SL (from heel bulb): 0.48–0.50 in post-trim cadaver controls. The centre of rotation of the DIP joint sits near the midpoint of the sagittal length. In the lameness group this was 0.46–0.47, indicating palmar displacement.
CoP-CoR/SL: approximately 0.15 in cadaver controls, rising to 0.21 in the lameness group — a highly significant difference (P < 0.001). This distance between the two points is the single most predictive measurement of solar arch state and palmar loading risk.
These parameters were selected because they directly quantify the couple arm — the horizontal distance between where the ground pushes up (CoP) and where the joint resists (CoR) — which is the mechanical driver of DIP joint loading as set out in Chapter One of Biomechanics for Farriers.
How many hooves? What were their morphologies? Shod or unshod?
The cadaver control group comprised 49 post-trim domestic forelimb specimens. These were trimmed to a standardised protocol before measurement, which means the CoP values reported are for the post-trim state, not for feet in whatever condition they arrived. This matters because it establishes what a correctly trimmed foot looks like, not what a convenience sample of random domestic horses looks like.
The clinical lameness group comprised 155 feet of horses presenting for MRI with digit-localised lameness. This group had a range of pathologies including navicular disease, DDFT pathology, and distal interphalangeal joint disease. The comparison between this group and the cadaver controls is what generates the pathology odds ratios — the quantification of how much each 0.01 change in CoP/SL increases the odds of navicular or DIPJ pathology.³
A third comparison group was the feral Australian horse population studied in the same work. Feral feet had significantly smaller CoP-CoR distances than domestic post-trim feet, reflecting the wider heel conformation, better-developed solar arch, and harder substrate that characterises naturally worn hooves. This population establishes a direction of travel rather than a prescriptive target — it is the biomechanical optimum that unrestricted natural wear produces, against which domestically managed feet can be compared.³
Regarding shod versus unshod hooves: the Caldwell PhD specimens were cadaver limbs trimmed without shoes. The Wilson 1998 force plate study included Thoroughbred-type horses with and without shoes and with wedge modifications, and is the primary source for the finding that a standard steel shoe applied to a balanced foot has minimal effect on the CoP trace, while mediolateral wedging displaces the CoP by approximately 10 mm per degree of wedge.¹ The Van Heel 2004–2006 pressure plate series studied both shod and barefoot horses and is the primary source for dynamic CoP variation through the shoeing interval — a separate and important question addressed below.²,⁴,⁵
How was the calculation model verified?
This is the most important methodological question, and the Caldwell work addresses it directly.
Verification of the external landmark positions against internal anatomy was the specific purpose of the cadaver study. For each specimen, the external positions of CoP (Duckett’s Dot, 9.5 mm palmar to frog apex), CoR (intersection of diagonal lines from heel buttresses), and breakover were measured from standardised photographs. The specimens were then dissected and the corresponding internal anatomical positions — the DIP joint centre of rotation and the DDFT insertion zone — were measured directly.
The results were not equivalent for the two landmarks.
The external CoR landmark — the widest point of the bearing border identified by the heel-to-toe diagonal line intersection — mapped reliably to the internal DIP joint centre of rotation. The correlation was R² = 84.3%, and the mean difference between external CoR and internal DIP joint CoR was not statistically significant (P = 0.11). The external CoR landmark is therefore trustworthy as a clinical reference point for trim and shoe prescription.³
The external CoP landmark — Duckett’s Dot — did not map reliably to the extensor process of P3, which is the internal landmark it is sometimes claimed to represent. The mean adjusted difference between the external CoP position and the extensor process was 7.4 mm, and this difference was statistically significant. The Caldwell PhD finding is explicit: Duckett’s Dot does not reliably locate the extensor process.³
This has a practical consequence. The external CoP landmark can be used as a dorsopalmar balance indicator — it approximates the mid-stance CoP position and is useful for assessing relative heel-toe loading. It cannot be used to locate specific internal structures for radiographic comparison. Clinicians and farriers who use it as a proxy for P3 position are working with a landmark that the verification data shows is not sufficiently precise for that purpose.
The dynamic measurement methodology — force plate and pressure plate — was verified against known physical standards in each of the primary studies. Both Wilson (1998) and Van Heel (2004) used dynamically calibrated equipment with published accuracy specifications. The force plate CoP calculation is a straightforward application of moment equilibrium that does not require model assumptions beyond the measurement geometry.¹,²
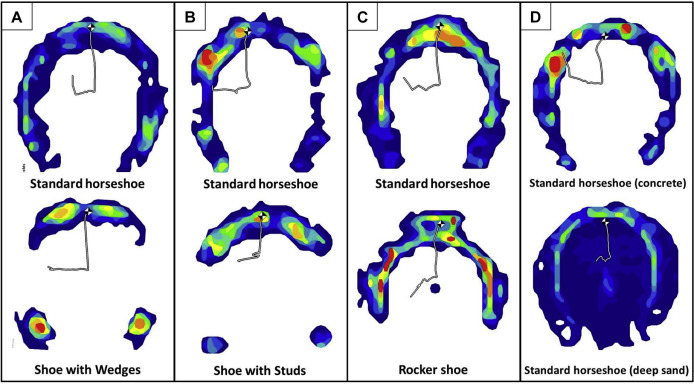
Commercial equine pressure mat system automatically calculate CoP and its trajectory through the stance phase and record peaks pressure at specific regions of the foot. Photo credit Jenny Hagen.
Where exactly is the CoP? The diagram shows a line, not a point.
You are correct that the CoP is a point, not a line. A diagram that shows a line indicator is showing the path of the CoP through time — the trajectory traced by the CoP as it moves from heel landing to toe-off during a single stance phase. At any instant, the CoP is a single point.
At mid-stance in a balanced foot at the walk, that point sits approximately 9.5 mm palmar to the frog apex — Duckett’s Dot — on the sagittal axis. This is the time point at which the vertical ground reaction force is at or near its peak, and it is the position used in static balance assessments.
The full CoP path through the stance phase is a curve that begins at landing and ends at toe-off. Understanding that curve, and how it changes with different loading conditions, is the subject of the next section.
How does CoP vary through the stance phase?
This is the question that the static mid-stance analysis does not answer, and it is biomechanically important. The CoP is not stationary during stance. It moves continuously from the moment of hoof landing to the moment of toe-off, and the pattern of that movement encodes information about how load is distributed through time and how different interventions affect the loading sequence.
The Van Heel pressure plate studies (2004, 2005, 2006) documented this trajectory systematically in domestic horses at the walk and trot, with and without shoes, and across the shoeing interval.²,⁴,⁵
At landing — heel contact phase — the CoP is displaced caudally, toward the heel. This reflects the initial load acceptance phase in which the heel contacts the ground first and the GRF acts predominantly through the heel region. In horses with a functionally normal foot and a well-developed palmar heel, this initial heel loading is followed by a rapid forward migration of the CoP as the limb accepts body weight and the foot settles into full contact.
At mid-stance — the peak loading phase — the CoP sits at its most consistent position, approximately beneath the DDFT insertion zone and corresponding to Duckett’s Dot on the external hoof surface. This is the phase at which body weight is fully transferred to the stance limb, vertical GRF peaks, and the force plate measurements that define the proportional reference values are primarily taken.
At breakover — the propulsive phase — the CoP migrates rapidly forward (dorsally) as heel unloading occurs and the foot rolls over the toe. This migration is the dynamic process behind the lever arm argument in our earlier articles: as the CoP moves forward relative to the DIP joint axis, the extending moment at the coffin joint increases and DDFT tension peaks. It is at this moment — CoP forward of CoR at maximum distance — that the therapeutic effect of a shorter toe or a rolled breakover is most mechanically significant.
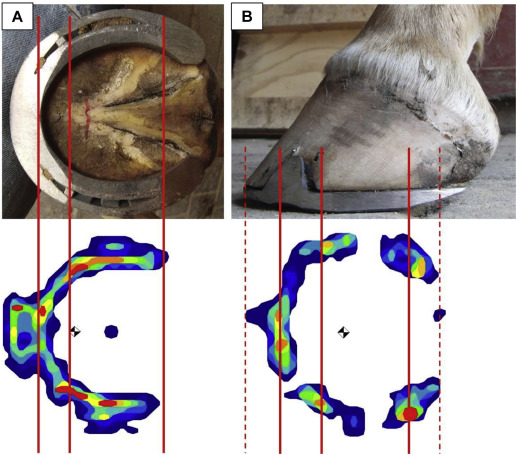
pressure mat data is colour coded the system records the peak at dedicated points of the foot through the stance phase to calculate the mean position. Dynamically this is seen as a line illustrating its course from impact to break over. Photo credit AFJ
The Van Heel 2005 study documented how the CoP trajectory changes across the eight-week shoeing interval in Thoroughbred-type horses. In the newly shod foot, the CoP sat in a relatively palmar position and the transition from mid-stance to breakover was smooth. At eight weeks, with the shoe growing out and the toe lengthening, the CoP had migrated dorsally at mid-stance, the breakover transition was delayed, and the forward excursion of the CoP into the propulsive phase was more abrupt. This is the biomechanical signature of the long-toe low-heel conformation that accumulates with each shoeing cycle: the mid-stance CoP migrates away from the CoR, the CoP-CoR distance increases, and the loading lever arm at the DIP joint progressively lengthens.⁴,⁵
In the mediolateral plane, Wilson (1998) documented that the CoP is displaced approximately 10 mm toward the elevated side for each 3.7 to 5 degree mediolateral wedge applied to the hoof. This displacement persists throughout the entire stance phase — it is not confined to mid-stance. The implication is that a foot that is out of mediolateral balance does not load medial and lateral structures alternately during the stride. It loads them asymmetrically throughout the entire stance phase of every stride.¹
Does the CoP vary with gait, load, and surface?
Yes, on all three counts, and the magnitudes of those variations are relevant to understanding the clinical significance of CoP position.
With gait: The vertical GRF amplitude increases with speed — from approximately 1 to 1.2 times body weight at the walk to 1.6 to 2.2 times body weight at the trot, and up to 3.5 times body weight at the landing phase of a fence. The CoP position does not change proportionally with force magnitude — it reflects the distribution of force, not the total force. However, the loading moment at the DIP joint does scale with force magnitude. A given CoP-CoR distance generates twice the loading moment at the trot that it generates at the walk, because the force acting through the couple arm is twice as large.
With surface: Van Heel (2006) documented that the CoP shift produced by a lateral extension shoe is attenuated by approximately 20 to 25 per cent on soft arena surfaces compared to firm ground. On soft footing, the surface conforms around the shoe web and partially erodes the CoP offset. The medial branch width then matters as a parallel mechanism — it resists sinking of the overloaded side and keeps the foot more level, producing a CoP shift through surface resistance rather than lever geometry. On firm surfaces the full calculated CoP shift is achievable; on soft surfaces only 75 to 80 per cent of it is.¹
With disease: The MRI lameness data in the Caldwell study documents that diseased feet have a significantly different CoP position from post-trim controls. The CoP/SL is higher in the lameness group (0.67–0.68 versus 0.64–0.65), indicating dorsal migration — consistent with the heel contraction and capsule distortion that accompany chronic palmar foot pain. The CoP-CoR distance is larger (0.21 versus 0.15), indicating a longer loading lever arm. The pathology odds ratios confirm that these differences are not random: each 0.01 increase in CoP/SL is associated with an odds ratio of 1.28 for navicular disease and 1.38 for DIPJ pathology.³
What the data says — and what it does not say
The CoP data from the Caldwell PhD and the force plate literature establishes several things with reasonable confidence.
The external CoR landmark maps reliably to the internal DIP joint centre of rotation and can be used for clinical trim and shoe prescription with confidence (R² = 84.3%, P = 0.11 for the mean difference).
The external CoP landmark approximates the mid-stance CoP position and is useful for dorsopalmar balance assessment. It does not reliably locate the extensor process of P3 (mean difference 7.4 mm, statistically significant) and should not be used for that purpose.
The CoP-CoR distance is the single measurement that best reflects solar arch state and palmar loading. It is significantly larger in horses with navicular, DDFT, and DIPJ pathology than in post-trim controls, and significantly smaller in feral horses than in domestic ones.
The CoP shifts dynamically through stance — from heel at landing, to the mid-stance position near Duckett’s Dot at peak loading, to the dorsal region at breakover. It is not a fixed point, and the clinical reference values all refer to the mid-stance position unless otherwise stated.
The mid-stance CoP position can be approximated from the external surface of a correctly trimmed foot using Duckett’s Dot. It is also measurable directly using force plate or pressure plate equipment in any clinical or research setting with access to such equipment.
What the data does not tell us is the CoP position in every possible variation of hoof morphology, disease state, gait, and surface combination. The reference population for the Caldwell values is post-trim domestic forelimb specimens and a clinical MRI lameness group. The values will differ for hindlimbs, for extreme conformations, for horses on asymmetric surfaces, and for gaits and activities beyond those studied. The reference values are exactly that — references. They describe a well-characterised population under defined conditions, and they should be applied with the awareness that any individual horse may deviate from them for reasons that are clinically meaningful.
A note on what these questions point to
The questions above are good questions not only because they are technically precise but because they are the right questions to ask of any published reference value. What is the data source? How large is the sample? What were the inclusion criteria? How was the model verified? What does it not tell you?
The reference values we cite from the Caldwell PhD and the Wilson and Van Heel force plate literature have been through peer review, are published in accessible journals, and are accompanied by the methodological details that allow their limitations to be understood. A trimming protocol that produces a CoP position within the reference range, verified by a pressure mat or force plate, is operating within the published evidence base. A protocol that claims to position the CoP correctly based on visual assessment of the external hoof surface, without force plate verification or radiographic correlation, is making a claim that goes beyond what the external landmark alone can support.
The evidence base is strong enough to be clinically useful. It is not strong enough to be applied as a universal absolute without acknowledging the sources of variation this article describes. The appropriate response to that uncertainty is not to abandon proportional balance measurement. It is to understand what the measurements mean, use them for the purpose for which they were validated, and remain honest about what they do not tell you.
Where the numbers in this article come from
- Wilson AM, Seelig TJ, Shield RA, Silverman BW. The effect of foot imbalance on point of force application in the horse. Equine Veterinary Journal 1998;30(6):540–545. [Primary force plate source for mediolateral CoP displacement; shoeing effects on CoP; n=8 Thoroughbred-type horses.]
- Van Heel MCV, Barneveld A, van Weeren PR, Back W. Dynamic pressure measurements for the detailed study of hoof balance: the effect of trimming in three horses. Equine Veterinary Journal 2004;36(5):430–435. [Pressure plate documentation of CoP trajectory through stance; trimming effects.]
- Caldwell MN. An investigation into the use of hoof balance metrics to test the universal applicability of a commonly used principle of hoof balance. PhD thesis, University of Liverpool, 2016/2017. [Primary source for proportional reference values: n=49 cadaver forelimb controls, n=155 MRI lameness cases, feral comparison population. CoR verification R²=84.3%. CoP-CoR/SL 0.15 controls vs 0.21 lameness, P<0.001. Extensor process mapping: 7.4 mm mean difference.]
- Van Heel MCV, van Weeren PR, Back W. Changes in location of centre of pressure and hoof-unrollment pattern in relation to an 8-week shoeing interval in the horse. Equine Veterinary Journal 2005;37(6):536–540. [Longitudinal documentation of CoP migration across shoeing interval.]
- Van Heel MCV, van Weeren PR, Back W. Shoeing sound Warmblood horses with a rolled toe optimises hoof-unrollment and lowers peak loading during breakover. Equine Veterinary Journal 2006;38(3):258–262. [Breakover geometry effects on CoP trajectory; rolled toe versus standard shoe.]
- Eliashar E, McGuigan MP, Wilson AM. Relationship of foot conformation and force applied to the navicular bone of sound horses at the trot. Equine Veterinary Journal 2004;36(5):431–435. [DDFT tension and navicular compression force plate data; heel elevation effects.]
- Hagen J, Geburek F, Kathrinaki V, Naem MA, Roecken M, Hoffmann J. Effect of perineural anaesthesia on the centre of pressure (COP) path during stance phase at trot in sound horses. Journal of Equine Veterinary Science 2021;101:103429. [Dynamic CoP path under anaesthesia; stance phase variation at trot.]
- Caldwell P, Madden S. Biomechanics for Farriers. Scientific Horseshoeing Limited, 2025 (pre-publication). Chapter 3: The reference model — proportional values, CoP-CoR clinical significance, sagittal/frontal plane distinction.
This article was written in response to reader questions about the CoP data cited in ‘What the “Drop the Heels” Protocols Aren’t Telling You About Your Laminitic Horse’ and the associated comment response. It is intended for horse owners and semi-professional trimmers who want to understand the evidence base for the measurements cited, rather than accept them on assertion. If you have further questions about the methodology, the links to the primary sources above will take you to the peer-reviewed literature.