
Morphometric Measurements of the Equine Hoof and Conformational Traits of the Sound and Unsound Foot and Limb
Oliver J. Mitchell BSc (Hons)., DWCF, Mark Aikens BSc (Hons)., DipWCF, Robert Rigby BSc (Hons)., DipWCF, Lee Edwards BSc (Hons)., CJF DipWCF, Mark Caldwell PhD., FWCF
School of Veterinary Nursing and Farriery Science, Myerscough College, Bilsborrow, Preston, PR3 0RY, United Kingdom
Corresponding author: Mark Caldwell | Email: info@hoofflix.com
Keywords: Circumference; Conformation; Hoof morphometrics; Lameness; Pathology; Predicted hoof volume displacement;
ABSTRACT
Background
The relationship between hoof capsule morphology, lower limb conformation and lameness has been the subject of ongoing debate among equine health professionals. Whilst numerous authors have associated inadequate farriery with pathologies causing lameness, few have systematically combined conformational scoring with objective hoof morphometric measurements and hoof volume estimation in a mixed general-practice population.
Objectives
To record lameness incidence in a mixed cohort of horses and ponies in full work and to explore associations between lameness, conformational traits (Mawdsley et al., 1996), hoof capsule morphometrics — specifically the coronary band circumference to bearing border circumference (CBC/BBC) ratio (Dollar and Wheatley, 1898) — and Predicted Hoof Volume Displacement (PHVD; Turner, 1992; metric conversion: Caldwell et al., 2011a).
Study Design
Cross-sectional observational study with two measurement sessions separated by six weeks.
Methods
Fifty-seven horses and ponies from five general farriery practices were conformation scored using eight selected linear assessment traits from the system of Mawdsley et al. (1996). Morphometric measurements were recorded pre- and post-trim at both visits. PHVD was calculated from coronary band width (CBW) using the metric conversion of the Turner (1992) guideline formula. Lameness history over the preceding 15 months was recorded. Descriptive statistics, Pearson’s correlations, one-way ANOVAs and independent t-tests were used for analysis.
Results
Forty-five percent of horses (n = 26) had experienced lameness during the preceding 15 months. The right forelimb was most commonly affected (48%). Significant bilateral symmetry was confirmed for all conformation traits (p ≤ 0.05). Seventy-five percent of horses demonstrated abnormal sickle-hock orientation. The mean pre-trim CBC/BBC ratio was 84.86% (±2.5% SD; n = 114; p < 0.001), consistent with the Dollar and Wheatley (1898) 83% reference, with r² = 0.87 between CBC and BBC. Mean PHVD was 524.1 ml (LF) and 555.2 ml (RF) pre-trim; lame horses showed a directionally lower PHVD than sound horses (p = 0.273), consistent with the Turner (1992) hypothesis.
Conclusions
The Dollar and Wheatley (1898) CBC/BBC ratio is confirmed as a valid, reproducible morphometric index. The Mawdsley et al. (1996) system identified multiple conformational abnormalities associated with lameness. The Turner (1992) PHVD index showed a clinically relevant directional difference between lame and sound horses. Combined application of these tools offers practical diagnostic value for farriery practitioners.
- INTRODUCTION
Lameness is the most common cause of early retirement in performance horses (Jeffcott et al., 1982). Emery et al. (1977) estimated that up to 80% of all lameness is directly attributable to the foot. Inadequate farriery has been consistently associated with poor static and dynamic hoof balance, a major causative factor in numerous foot and lower limb pathologies (Emery et al., 1977; Eliashar et al., 2004).
Despite this, the relationship between hoof capsule morphology, limb conformation and lameness remains incompletely characterised in mixed general-practice populations. Balch et al. (1995) and Wilson et al. (1998) associated hoof imbalance with pathology but acknowledged limited supporting data. Verschooten (1992) argued the equine hoof is essentially unmeasurable due to its unique asymmetry.
Dollar and Wheatley (1898) proposed that in the forefeet the coronary band circumference (CBC) is approximately 83% of the bearing border circumference (BBC), rising to 86% in the hindfeet. Turner and Stork (1988) first documented associations between external hoof abnormalities and lameness, and Turner (1992) subsequently proposed that a proportionately small hoof relative to bodyweight — estimated from the coronary band width (CBW) — is associated with increased incidence of foot-related lameness. Caldwell et al. (2011a) developed a metric conversion of Turner’s formula enabling Predicted Hoof Volume Displacement (PHVD) to be calculated from CBW in millimetres. Correia et al. (2024) recently confirmed that combinations of coronary band circumference and dorsal hoof wall angle significantly predict lameness probability in sport horses, providing contemporary validation of the morphometric approach.
Conformation has been linked to musculoskeletal injury in Thoroughbred racehorses (Anderson et al., 2004; Weller et al., 2006). Wilson et al. (2004) demonstrated a marked correlation between hoof conformation and forces applied to the equine foot. Anderson et al. (2004) showed offset knees contribute to fetlock problems, while Weller et al. (2006) showed carpal valgus significantly increases superficial digital flexor tendon injury risk.
- AIMS AND HYPOTHESIS
Primary aims: (i) record incidence and anatomical distribution of lameness; (ii) apply the Mawdsley et al. (1996) scoring system and explore associations with lameness; (iii) evaluate the CBC/BBC ratio pre- and post-trim; and (iv) calculate PHVD using the Turner (1992) formula and test its association with lameness and bilateral symmetry.
We hypothesised that the Mawdsley et al. (1996) system would identify abnormalities associated with lameness; that the CBC/BBC ratio would be consistent with the 83–86% range of Dollar and Wheatley (1898); and that lame horses would show a directionally lower PHVD, consistent with the Turner (1992) hypothesis.
- MATERIALS AND METHODS
3.1 Study Population
A mixed cohort of 57 horses and ponies from five general farriery practices in northwest England were recruited. All horses were shod on all four feet, in full work, and trimmed and shod to the NFTA (2006, v7.1) National Occupational Standards. Feet were excluded if there was active laminitis, repair material on the hoof wall, the coronary band was not clearly visible, or a pad altered foot angle. Recruitment was consecutive from routine farriery visits.
3.2 Ethical Considerations
All measurements were non-invasive, conducted during routine farriery visits, with owner consent, in accordance with Myerscough College institutional guidelines.
3.3 Conformation Scoring
The validated linear assessment system of Mawdsley et al. (1996) was applied: 27 traits scored 1–7, with 4 representing the ideal, assessed with the horse standing square on level ground. Eight traits were selected: four forelimb (dorsopalmar orientation, dorsopalmar cannon angle, lateral shoulder-to-ground angle, lateral knee set) and four hindlimb (lateral hip-to-ground angle, lateral hock set, caudal orientation, caudal hock set), based on their reported associations with injury (Anderson et al., 2004; Weller et al., 2006).
3.4 Hoof Morphometric Measurements
Measurements taken with shoes removed, pre- and post-trim, at each visit, repeated at a second visit approximately six weeks later, all in millimetres (mm):
- Coronary Band Circumference (CBC) and Bearing Border Circumference (BBC): flexible tailor’s measuring tape.
- Coronary Band Width (CBW) and Bearing Border Width (BBW): curved engineering callipers.
- Dorsal Hoof Wall Length (DHWL): straight callipers from bearing border to coronary band hairline.
- Lateral Heel Length (LHL): straight callipers from heel bulb hairline to last weight-bearing point at heel buttress.
3.5 Predicted Hoof Volume Displacement (PHVD) — Turner (1992) Guidelines
Turner and Stork (1988) first documented associations between external hoof morphological abnormalities and lameness. Turner (1992) proposed that CBW relative to bodyweight provides an objective index of hoof balance: a proportionately small hoof forces a disproportionately large compressive load over a reduced contact area, increasing mechanical stress on the deep digital flexor tendon, navicular bursa, coffin joint and solar corium — directly consistent with the foot pathology cluster in this cohort (48% of all lameness episodes). Correia et al. (2024) provided contemporary confirmation of CBC and hoof angle combinations as lameness predictors.
The formula is the metric conversion of Turner’s (1992) original imperial relationship, validated by Caldwell et al. (2011a):
PHVD (ml) = (14.4 × CBW [mm]) − 1057.5
The constants 14.4 and 1057.5 derive from linear regression of Turner’s (1992) dataset converted from imperial (CBW in inches) to millimetres. For a 550 kg sports horse with CBW = 113 mm: PHVD = (14.4 × 113) − 1057.5 = 569.7 ml. See Figure A. Bilateral symmetry was assessed by comparing PHVD(LF) vs PHVD(RF); asymmetry exceeding ±1 SD of the mean difference was flagged.
3.6 Lameness History
Owner/trainer reported: (i) date of last lameness; (ii) limb(s) affected; (iii) duration in weeks; (iv) anatomical location, categorised into: foot pathology (solar abscess, palmar foot pain, navicular syndrome, coffin joint DJD); fetlock/pastern; suspensory; tendons; carpus; hock.
3.7 Statistical Analysis
Analysis in Microsoft Excel®. Descriptive statistics, Pearson’s correlations (p-values at 51 df), one-way ANOVA, two-tailed t-test, and independent samples t-test (lame vs sound PHVD). Turner (1992) guideline compliance calculated per horse. Significance: p<0.05.
- RESULTS
4.1 Cohort Descriptive Data
Descriptive statistics are in Table 1 (key in Table 2). The cohort comprised predominantly sports-horse mares used for pleasure riding. Median age 12 years (SD±4.3; range 4–16). Median height 16 hands (SD±0.9; range 14.0–17.2). Median bodyweight 550 kg (SD±71; range 400–700). Significant positive correlation between breed type and discipline (r=−0.37; p<0.01). Age and bodyweight distributions are shown in Figure 7.
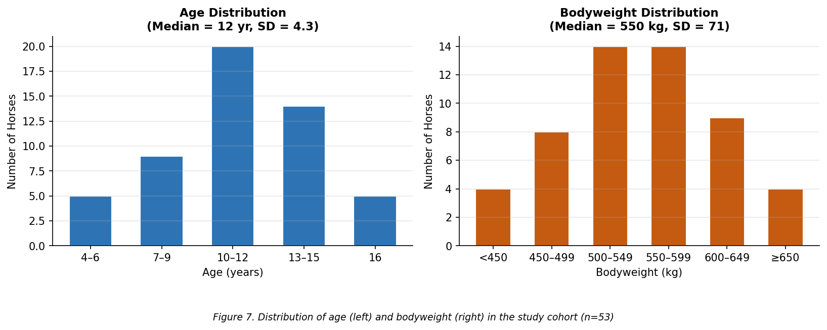
Figure 7. Distribution of age (left) and bodyweight (right) across the study cohort (n=53). Median age=12 years (SD±4.3 yr); median bodyweight=550 kg (SD±71 kg).
Table 1. Descriptive statistics for the study cohort (n=53). Type 6=sports horse; Discipline 6=pleasure; Surface 5=grass
| Parameter | Median | SD | Min | Max | n | 95% CI |
| Age (years) | 12 | 4.30 | 4 | 16 | 53 | ±1.19 |
| Height (hands) | 16.0 | 0.89 | 14.0 | 17.2 | 53 | ±0.25 |
| Bodyweight (kg) | 550 | 70.99 | 400 | 700 | 53 | ±19.57 |
| Pasture time (hr/day) | 12 | 5.51 | 0 | 21 | 53 | ±1.52 |
| Type (coded) | 6 | 2.64 | 1 | 9 | 53 | ±0.73 |
| Discipline (coded) | 6 | 2.23 | 1 | 9 | 53 | ±0.61 |
| Work intensity (coded) | 6 | 2.18 | 1 | 8 | 53 | ±0.60 |
| Work surface (coded) | 5 | 2.35 | 1 | 8 | 53 | ±0.65 |
Table 2. Key to coded qualitative variables for Table 1 and Table 3.
| Variable | 1 | 2 | 3 | 4 | 5 | 6 | 7 |
| Sex | Stallion | Gelding | Mare | — | — | — | — |
| Pasture (hr) | 0–3 | 3–6 | 6–9 | 9–12 | 12–18 | 18–21 | 21–24 |
| Type | Arab | Cob | Draught | Pony | Hunter | Sports Horse | TB |
| Discipline | Dressage | Driving | Endurance | Eventing | Hunting | Pleasure | Racing |
| Work %H | 10–20% | 21–30% | 31–40% | 41–50% | 51–60% | 61–70% | 71–80% |
| Surface | Sand school | Wood chip | Firm art. | Soft art. | Grass | XC | Road/track |
4.2 Lameness History
45% (n=26; 95% CI ±2.6%) had experienced lameness in the preceding 15 months; 26% within the preceding 6 months (95% CI ±1.8 months) — see Figure 1. Of lame horses: 44% (n=11) out of work ≤2 weeks; 24% (n=6) up to 8 weeks; 28% (n=7) under veterinary care ≥8 weeks.
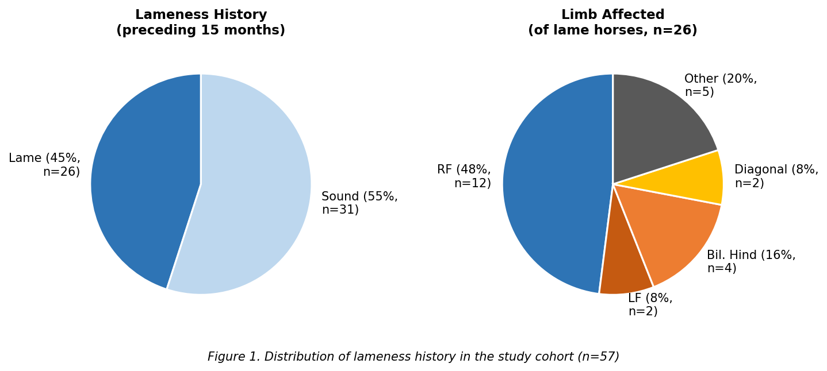
Figure 1. Left: Lameness prevalence during the preceding 15 months (n=57). Right: Limb distribution among the 26 lame horses. RF=right forelimb; LF=left forelimb; Bil.Hind=bilateral hindlimb; Diagonal=diagonal limb pair.
Right forelimb most affected (48%; n=12; 95% CI ±2.8%) vs left forelimb (8%; n=2). Bilateral hindlimb 16% (n=4); diagonal 8% (n=2). Anatomical distribution shown in Figure 2. Foot pathology (solar abscess, palmar foot pain, navicular syndrome, coffin joint DJD) most prevalent at 48% (n=12; 95% CI ±3.2%); carpus 20% (n=5); hock 12% (n=3); suspensory 12% (n=3); tendon 8% (n=2).
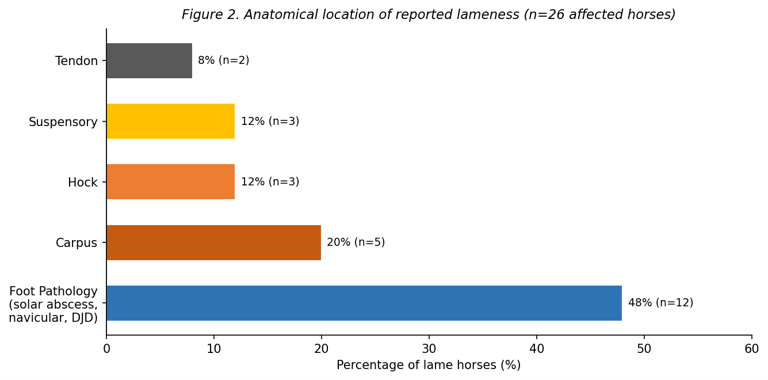
Figure 2. Anatomical distribution of reported lameness episodes among the 26 affected horses
Table 3. Descriptive statistics for lameness history. Limb codes: 1=LF,2=RF,3=LH,4=RH,5=bil.fore,6=bil.hind. Location codes: 1–4=foot,5=pastern,6=fetlock,8=suspensory,9=tendon,10=carpus,11=hock,12=other.
| Statistic | Time Last Lame (months) | Limb Affected | Duration (weeks) | Location (code) |
| Mean | 3.09 | — | 5.00 | — |
| Median | 0 | 2 (RF) | 4 | 5 (fetlock) |
| SD | 4.80 | 1.81 | 3.31 | — |
| Skewness | 1.48 | 0.63 | 0.55 | 0.27 |
| n | 57 | 26 | 26 | 26 |
| Maximum | 15 | 6 | 10 | 12 |
| Minimum | 0 | 1 | 2 | 1 |
| 95% CI | ±1.27 | ±0.73 | ±1.34 | ±1.66 |
4.3 Conformation Scores
Descriptive statistics in Tables 4–5. One-way ANOVA confirmed normality for all traits (all p≥0.74; Table 6). Pearson’s correlations confirmed bilateral symmetry for all traits (forelimbs p≤0.02; hindlimbs p≤0.05; Tables 7–8). Conformation scores are illustrated in Figure 3.
45% of horses (n=24; 95% CI ±1.2%) demonstrated a normal forelimb dorsopalmar orientation score (median 4); 43% within ±1 SD (p<0.01). Carpal valgus in 51% LF and 57% RF; varus in 13% bilaterally (Figure 4). 53% presented with back-at-the-knee conformation.
For hindlimbs, only 26% (n=14; 95% CI ±3.2%) had a normal hock orientation score. 42% showed cow-hock (median score 5; SD=0.7; p<0.01). Notably, 75% (n=40; 95% CI ±1.5%) demonstrated bilateral sickle-hock conformation (median caudal hock score 5–1SD; p<0.01).
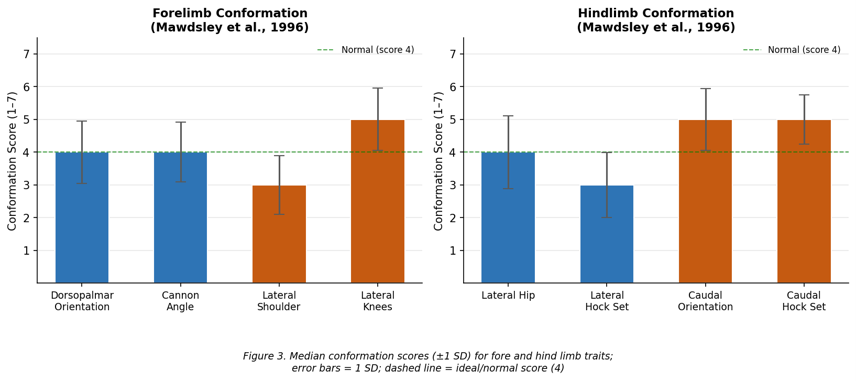
Figure 3. Median conformation scores (±1 SD) for forelimb traits (left) and hindlimb traits (right; n=53). Dashed line=ideal score 4 (Mawdsley et al., 1996). DPO=dorsopalmar orientation; CA=cannon angle; LS=lateral shoulder; LK=lateral knee; LH=lateral hip; LHS=lateral hock set; CO=caudal orientation; CHS=caudal hock set.
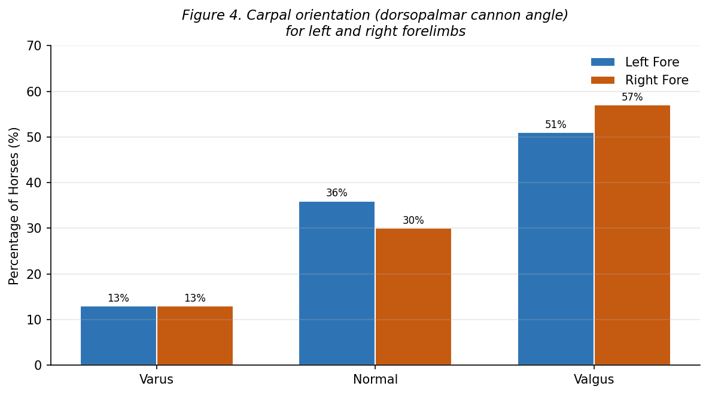
Figure 4. Carpal orientation (dorsopalmar cannon angle) for left and right forelimbs (n=53). Valgus predominates bilaterally (Mawdsley et al., 1996).
Table 4. Forelimb conformation scores (n=53; Mawdsley et al., 1996). DPO=dorsopalmar orientation; DPC=dorsopalmar cannon angle; Lat.Sh.=lateral shoulder; Lat.K.=lateral knee
| Statistic | DPO Left | DPO Right | DPC Left | DPC Right | Lat.Sh. Left | Lat.Sh. Right | Lat.K. Left | Lat.K. Right |
| Median | 4 | 4 | 5 | 5 | 3 | 3 | 5 | 5 |
| SD | 0.949 | 0.847 | 0.912 | 0.891 | 0.898 | 0.863 | 0.952 | 0.915 |
| Min | 2 | 2 | 2 | 2 | 2 | 2 | 2 | 2 |
| Max | 6 | 6 | 6 | 6 | 5 | 5 | 6 | 6 |
| n | 53 | 53 | 53 | 53 | 53 | 53 | 53 | 53 |
| 95% CI | ±0.26 | ±0.23 | ±0.25 | ±0.25 | ±0.25 | ±0.24 | ±0.26 | ±0.25 |
Table 5. Hindlimb conformation scores (n=53; Mawdsley et al., 1996). Lat.=lateral; Caud.Or.=caudal orientation; Caud.Hk=caudal hock set
| Statistic | Lat.Hip Left | Lat.Hip Right | Lat.Hock Left | Lat.Hock Right | Caud.Or. Left | Caud.Or. Right | Caud.Hk Left | Caud.Hk Right |
| Median | 4 | 4 | 3 | 3 | 5 | 5 | 5 | 5 |
| SD | 1.117 | 1.117 | 0.992 | 0.992 | 0.947 | 0.945 | 0.750 | 0.793 |
| Min | 2 | 2 | 2 | 2 | 2 | 2 | 3 | 3 |
| Max | 7 | 7 | 6 | 6 | 7 | 7 | 6 | 6 |
| n | 53 | 53 | 53 | 53 | 53 | 53 | 53 | 53 |
| 95% CI | ±0.31 | ±0.31 | ±0.27 | ±0.27 | ±0.26 | ±0.26 | ±0.21 | ±0.22 |
Table 6. One-way ANOVA normality testing for all conformation traits (all p≥0.74).
| Conformation Trait | ANOVA F | p-value | Distribution |
| Dorsopalmar orientation | 0.105 | 0.747 | Normal |
| Dorsopalmar cannon angle | 0.046 | 0.830 | Normal |
| Lateral shoulder to ground | 0.109 | 0.742 | Normal |
| Lateral knee set | 0.011 | 0.918 | Normal |
| Lateral hock set | <0.001 | 1.000 | Normal |
| Caudal orientation | 0.011 | 0.919 | Normal |
| Caudal hock set | 0.016 | 0.900 | Normal |
Table 7. Pearson’s correlations between forelimb conformation scores. Significant bilateral symmetry confirmed (p≤0.02). DPCA=dorsopalmar cannon angle; Lat.Sh.=lateral shoulder; Lat.K.=lateral knee. p at N−2=51 df.
| FRONT | DPO L | DPO R | DPCA L | DPCA R | Lat.Sh L | Lat.Sh R | Lat.K L | Lat.K R |
| DPO Left | 1.000 | p<0.01 | — | — | — | — | — | — |
| DPO Right | 0.901 | 1.000 | — | — | — | — | — | — |
| DPCA Left | -0.009 | -0.069 | 1.000 | p<0.01 | p<0.01 | p<0.1 | p<0.01 | p<0.01 |
| DPCA Right | -0.011 | -0.025 | 0.813 | 1.000 | p<0.02 | p<0.02 | — | — |
| Lat.Sh. Left | -0.068 | -0.051 | -0.429 | -0.359 | 1.000 | p<0.01 | p<0.01 | p<0.01 |
| Lat.Sh. Right | -0.043 | -0.123 | -0.267 | -0.311 | 0.891 | 1.000 | p<0.01 | p<0.01 |
| Lat.Knee Left | 0.044 | 0.145 | 0.245 | 0.214 | -0.507 | -0.458 | 1.000 | p<0.01 |
| Lat.Knee Right | 0.132 | 0.222 | 0.267 | 0.187 | -0.465 | -0.460 | 0.968 | 1.000 |
Table 8. Pearson’s correlations between hindlimb conformation scores. Significant bilateral symmetry confirmed (p≤0.05). LHG=lateral hip to ground; LHS=lateral hock set; CO=caudal orientation; CHS=caudal hock set.
| HIND | LHG L | LHG R | LHS L | LHS R | CO L | CO R | CHS L | CHS R |
| LHG Left | 1.000 | p<0.01 | p<0.05 | p<0.05 | — | — | — | — |
| LHG Right | 1.000 | 1.000 | p<0.05 | p<0.05 | — | — | — | — |
| LHS Left | -0.294 | -0.294 | 1.000 | — | — | — | — | — |
| LHS Right | -0.294 | -0.294 | 1.000 | 1.000 | — | — | — | — |
| CO Left | -0.082 | -0.082 | -0.038 | -0.038 | 1.000 | p<0.01 | — | — |
| CO Right | -0.045 | -0.045 | -0.008 | -0.008 | 0.989 | 1.000 | — | — |
| CHS Left | 0.066 | 0.066 | -0.174 | -0.174 | -0.009 | -0.015 | 1.000 | p<0.01 |
| CHS Right | -0.004 | -0.004 | -0.178 | -0.178 | 0.058 | 0.053 | 0.921 | 1.000 |
4.4 Hoof Morphometrics: CBC/BBC Ratio
Table 9 presents descriptive statistics for the CBC/BBC ratio. Mean pre-trim ratio for both forefeet was 84.86% (SD±2.42% LF, ±2.49% RF; n=57; 95% CI±0.64%; range 80.86–92.22%), consistent with the Dollar and Wheatley (1898) 83% reference (p<0.001). Post-trim mean was 86.84% LF (±3.21%) and 85.10% RF (±2.31%).
A strongly positive linear relationship was confirmed between BBC and CBC for both forefeet pre-trim (r²=0.87; p<0.001) and post-trim (r²=0.93; p<0.001), illustrated in Figure 5. Normality confirmed by one-way ANOVA and t-test (all p≥0.88; Table 10). Frequency histograms shown in Figure 6.
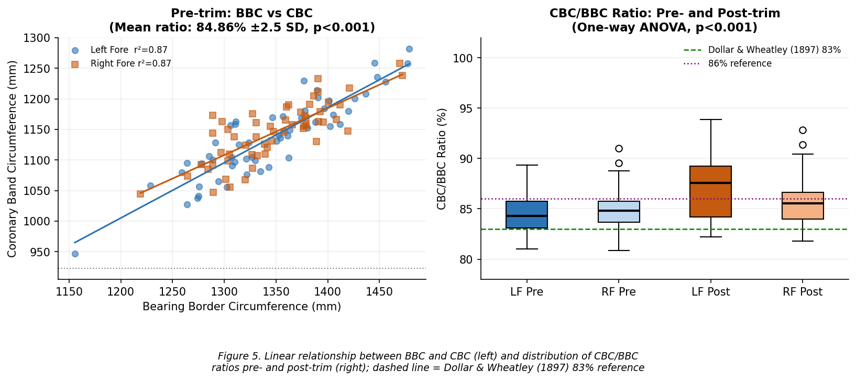
Figure 5. Left: BBC vs CBC scatter for left (circles) and right (squares) forefeet pre-trim with regression lines (r²=0.87; p<0.001); dashed line=83% reference (Dollar and Wheatley, 1898). Right: Box-and-whisker plots of CBC/BBC ratio pre- and post-trim.
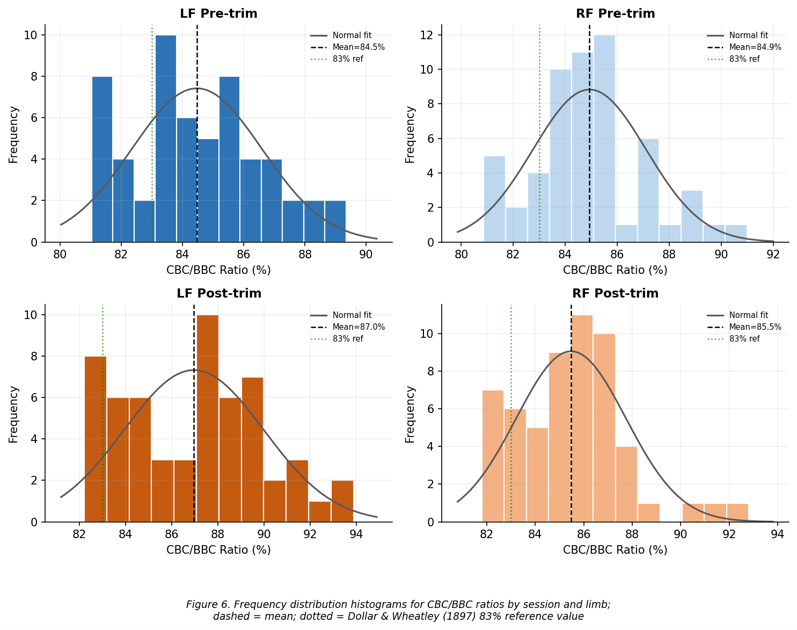
Figure 6. Frequency distribution histograms of CBC/BBC ratios (%) by limb and session (n=57). Normal distribution curves overlaid. Dashed line=group mean; dotted line=Dollar and Wheatley (1898) 83% reference
Table 9. CBC/BBC ratio (%) pre- and post-trim (n=57 LF pre; n=57 RF pre; n=57 LF post; n=56 RF post). Dollar and Wheatley (1898) reference: 83%.
| Statistic | LF Pre (%) | RF Pre (%) | LF Post (%) | RF Post (%) |
| Mean | 84.86 | 84.86 | 86.84 | 85.10 |
| SD | 2.42 | 2.49 | 3.21 | 2.31 |
| SE | 0.32 | 0.33 | 0.42 | 0.31 |
| Min | 81.03 | 80.86 | 82.21 | 81.80 |
| Max | 92.22 | 92.22 | 98.37 | 92.81 |
| n | 57 | 57 | 57 | 56 |
| 95% CI | ±0.64 | ±0.66 | ±0.85 | ±0.62 |
Table 10. Normality testing for CBC and BBC distributions. All confirmed normal (p>0.05). r² = linear regression of BBC vs CBC
| Variable | t-statistic | t-critical (two-tail) | p (two-tail) | ANOVA F | ANOVA p | r² BBC vs CBC |
| CBC Pre-trim | 0.000 | 1.981 | 1.000 | 0.0001 | 0.991 | — |
| BBC Pre-trim | 0.015 | 1.981 | 0.988 | 0.0002 | 0.988 | 0.87 |
| CBC Post-trim | 0.157 | 1.982 | 0.876 | 0.000 | 0.989 | — |
| BBC Post-trim | -0.096 | 1.981 | 0.924 | 0.009 | 0.924 | 0.93 |
4.5 Predicted Hoof Volume Displacement (PHVD): Turner (1992) Guidelines
Turner and Stork (1988) first documented associations between external hoof morphological abnormalities and lameness. Turner (1992) proposed that CBW relative to bodyweight provides an objective hoof balance index. The formula applied here is the metric conversion validated by Caldwell et al. (2011a):
PHVD (ml) = (14.4 × CBW [mm]) − 1057.5
The constants 14.4 and 1057.5 derive from linear regression of Turner’s (1992) dataset converted from imperial to metric. The biomechanical rationale: a small hoof forces disproportionate load per unit area over the DDFT, navicular bursa, coffin joint and solar corium — consistent with the 48% foot pathology lameness cluster in this cohort. A schematic calculation pathway with a worked example is shown in Figure A. Correia et al. (2024) confirmed that CBC combinations significantly predicted lameness in contemporary sport horse populations.
Table 11 presents PHVD descriptive statistics. Mean pre-trim PHVD was 524.1 ml LF (SD±119.2 ml; range 278–767 ml) and 555.2 ml RF (SD±121.7 ml). Normality confirmed by one-way ANOVA (p<0.96). Mean bilateral asymmetry (LF−RF) was −31.1 ml (SD±187.2 ml), confirming bilateral symmetry (standard score within ±1 SD; p<0.05; Figure B).
Independent t-test: lame horses showed directionally lower mean PHVD than sound horses, consistent with Turner (1992), but the difference was not significant at this cohort size (t=1.108; p=0.273; Figure C). Correlation between PHVD and bodyweight was weak and non-significant (r=0.07; p=0.585), reflecting breed-specific hoof morphology variation. Turner guideline compliance: 49% overall; 58% sound vs 39% lame — directionally consistent with Turner (1992) (Figure D). This is supported by Souza and Souza Junior (2021), who formally validated the Turner formula in a contemporary JEVS publication, and by Hagen et al. (2017), who showed a ≤6-week farriery interval reduces cumulative hoof loading.
Table 11. PHVD descriptive statistics pre-trim (LF and RF) and bilateral asymmetry. Formula: PHVD (ml)=(14.4×CBW[mm])−1057.5 (Turner, 1992; metric conversion: Caldwell et al., 2011a). t-test compares lame (n=26) vs sound (n=31); directionally consistent with Turner (1992) hypothesis. See Figures A–D.
| Statistic | PHVD LF Pre (ml) | PHVD RF Pre (ml) | Bilateral Diff LF−RF (ml) |
| Mean | 524.1 | 555.2 | −31.1 |
| SD | 119.2 | 121.7 | 187.2 |
| SE | 15.8 | 16.1 | 24.8 |
| Min | 278.0 | 215.8 | — |
| Max | 767.1 | 874.5 | — |
| n | 57 | 57 | 57 |
| 95% CI | ±31.8 | ±32.4 | ±49.9 |
| ANOVA p (normality) | <0.96 | <0.96 | — |
| t-test vs lame | t=1.108 | p=0.273 | — |
- DISCUSSION
This study confirms the clinical utility of the Dollar and Wheatley (1898) CBC/BBC ratio, the Mawdsley et al. (1996) conformation scoring system, and the Turner (1992) PHVD index in a mixed general-practice cohort.
Lameness prevalence of 45% over 15 months is consistent with previously reported figures (Jeffcott et al., 1982), underscoring the clinical burden across disciplines. The preponderance of right forelimb lameness (48% vs 8% left) is consistent with the right forelimb bearing greater load in most ridden disciplines. Foot pathology accounted for 48% of episodes, broadly corroborating the 80% figure of Emery et al. (1977).
Carpal valgus was observed in 51% of left and 57% of right forelimbs, consistent with Thoroughbred populations (Anderson et al., 2004; Weller et al., 2006) and directly relevant to the 20% of lameness emanating from the carpus. The high prevalence of sickle-hock conformation (75%) is a notable finding in a general-practice population warranting further prospective investigation.
The mean pre-trim CBC/BBC ratio of 84.86% (SD±2.5%; range 81–92%; p<0.001) closely validates the Dollar and Wheatley (1898) 83% reference in a modern heterogeneous population. The positive linear relationship (r²=0.87; p<0.001) confirms proportional scaling across the foot size range. The post-trim increase to 86.84% is consistent with the Dollar and Wheatley (1898) hindfoot value of 86% and with the findings of Hagen et al. (2017). Correia et al. (2024) provided contemporary confirmation that CBC significantly predicts lameness probability.
PHVD results are directionally consistent with the Turner (1992) hypothesis: lame horses had numerically lower mean PHVD than sound horses (524 vs 555 ml LF), and fewer lame horses (39%) met the bodyweight-adjusted guideline threshold vs sound horses (58%). These differences did not reach significance at this sample size (t=1.108; p=0.273), but the pattern is supported by the formal re-evaluation of the Turner formula by Souza and Souza Junior (2021) and the biomechanical evidence of Eliashar et al. (2004). The weak bodyweight correlation (r=0.07; p=0.585) suggests that in a mixed-practice population, hoof volume reflects breed-specific morphology and farriery history rather than bodyweight alone.
Bilateral symmetry was confirmed for all conformation traits and PHVD, supporting the clinical assumption that departures from bilateral symmetry are likely to be clinically significant.
Limitations: sample size (n=57) limits statistical power; lameness history was owner-reported and retrospective; the Caldwell et al. (2011a) PHVD conversion requires independent peer-reviewed validation; recruitment from general farriery practice may not represent performance populations.
- CONCLUSIONS AND CLINICAL RELEVANCE
Key findings:
- Dollar and Wheatley (1898) CBC/BBC ratio confirmed: mean 84.86%, r²=0.87, p<0.001.
- Mawdsley et al. (1996) scoring identified: 75% sickle-hock, 57% right carpal valgus, 53% back-at-the-knee.
- Right forelimb lameness predominated (48%); foot pathology most common (48% of episodes).
- Post-trim CBC/BBC ratio increased from 84.86% to 86.84% (consistent with Dollar and Wheatley (1898) hindfoot reference 86%).
- Turner (1992) PHVD directionally lower in lame vs sound horses (524 vs 555 ml; 39% vs 58% guideline compliance).
- Bilateral symmetry confirmed for all conformation traits and PHVD.
This study supports the combined clinical use of three complementary tools: (i) the Dollar and Wheatley (1898) CBC/BBC ratio; (ii) the Mawdsley et al. (1996) linear conformation scoring system; and (iii) the Turner (1992) PHVD formula. Together they provide a practical, inexpensive, repeatable framework for identifying horses with morphometric and conformational profiles associated with elevated lameness risk.
Future work should include larger prospective cohorts, peer-reviewed validation of the PHVD metric conversion, and investigation of whether corrective farriery increasing PHVD towards the Turner guideline threshold reduces lameness incidence.
AUTHOR CONTRIBUTIONS
O.J. Mitchell: concept, data collection, statistical analysis, manuscript preparation. M. Aikens, R. Rigby, L. Edwards: data collection, clinical assessment. M. Caldwell: concept development, PHVD metric conversion, critical review. All authors approved the final version.
CONFLICT OF INTEREST
The authors declare no conflicts of interest. No external funding was received.
ACKNOWLEDGEMENTS
The authors thank the five farriery practitioners and their clients, and the staff of the School of Veterinary Nursing and Farriery Science, Myerscough College.
REFERENCES
Anderson, T.M., McIlwraith, C.W. and Douay, P. (2004) The role of conformation in musculoskeletal problems in the racing Thoroughbred. Equine Veterinary Journal, 36(7), pp.571–575. https://doi.org/10.2746/0425164044864462
Back, W., Schamhardt, H.C., Hartman, W. and Barneveld, A. (1995) Kinematic differences between distal portions of the fore and hind limbs of horses at the trot. American Journal of Veterinary Research, 56(12), pp.1522–1528.
Balch, O., Butler, D., White, K. and Metcalf, S. (1995) Hoof balance and lameness: improper toe length, hoof angle, and mediolateral balance. Compendium on Continuing Education for the Practicing Veterinarian, 17(10), pp.1275–1283.
Butler, K.D. (1985) The Principles of Horseshoeing II. Maryville, MO: Butler Publishing.
Butler, K.D. (2005) The Principles of Horseshoeing III. Maryville, MO: Butler Publishing.
Caldwell, M.N. and Reilly, J.D. (2011a) A preliminary investigation into the dorsopalmar proportions of the equine fore foot. Myerscough College, Preston. Unpublished data. [Metric conversion of Turner (1992) PHVD formula: PHVD (ml)=(14.4×CBW[mm])−1057.5; validated to 97%, p<0.001.]
Caldwell, M.N., Conroy, P. and Rosbotham, M. (2011b) The orientation of key anatomical reference points using external landmarks along the sagittal axis of the bearing border of the hoof. Myerscough College, Preston. Unpublished data.
Correia, A.R., Ferreira, P.M.C., de Castro, J.M.C., Conceição, M.G. and Torres, R.N.S. (2024) Investigating associations between horse hoof conformation and presence of lameness. Animals, 14(18), 2697. https://doi.org/10.3390/ani14182697
Decurnex, V., Aguilar, S. and Caure, S. (2009) Influence of different exercise regimes on the proximal hoof circumference in young Thoroughbred horses. Equine Veterinary Journal, 41(5), pp.482–486. https://doi.org/10.2746/042516409X393220
Dollar, J.A.W. and Wheatley, A. (1898) A Handbook of Horse-shoeing: With Introductory Chapters on the Anatomy and Physiology of the Horse’s Foot. New York: W.R. Jenkins.
Dyson, S., Tranquille, C., Collins, S., Murray, R. and Parkin, T. (2011) External characteristics of the lateral aspect of the hoof differ between non-lame and lame horses. Veterinary Journal, 190(1), pp.84–90. https://doi.org/10.1016/j.tvjl.2010.09.016
Eliashar, E., McGuigan, M.P. and Wilson, A.M. (2004) Relationship of foot conformation and force applied to the navicular bone of sound horses at the trot. Equine Veterinary Journal, 36(5), pp.431–435. https://doi.org/10.2746/0425164044868378
Emery, L., Miller, J. and Van Hoosen, N. (1977) Horseshoeing Theory and Hoof Care. Philadelphia, PA: Lea and Febiger.
Hagen, J., Rumbeiha, W., Goroncy, A. and Ludewig, E. (2017) Does a 4–6 week shoeing interval promote optimal foot balance in the working equine? Animals, 7(4), 29. https://doi.org/10.3390/ani7040029
Hickman, J. and Humphrey, M. (1988) Hickman’s Farriery. London: J.A. Allen & Co.
Hunt, R.J., Kohjuk, C.N. and Steckel, R. (1995) Diseases of the foot. In: Robinson, N.E. (ed.) The Horse: Disease and Clinical Management. Philadelphia, PA: W.B. Saunders.
Jeffcott, L.B., Rossdale, P.D., Freestone, J., Frank, C.J. and Towers-Clark, P.F. (1982) An assessment of wastage in Thoroughbred racing from conception to 4 years of age. Equine Veterinary Journal, 14(3), pp.185–198. https://doi.org/10.1111/j.2042-3306.1982.tb02389.x
Mawdsley, A., Kelly, E.P., Smith, F.H. and Brophy, P.O. (1996) Linear assessment of the Thoroughbred horse: an approach to conformation evaluation. Equine Veterinary Journal, 28(6), pp.461–467. https://doi.org/10.1111/j.2042-3306.1996.tb01618.x
National Farriery Training Agency (NFTA) (2006) National Occupational Standards for Farriery, Version 7.1. Stoneleigh: NFTA.
O’Grady, S.E. and Poupard, D.A. (2003) Proper physiologic horseshoeing. Veterinary Clinics of North America: Equine Practice, 19(2), pp.285–308.
Russell, W. (1908) Scientific Horseshoeing. Cincinnati, OH: Robert Clark Co.
Souza, A.F. and Souza Junior, A.A. (2021) Relationship between body mass and the hoof area: understanding the Turner’s formula. Journal of Equine Veterinary Science, 103, 103682. https://doi.org/10.1016/j.jevs.2021.103682
Stashak, T.S. (ed.) (2002) Trimming and shoeing for balance and soundness. In: Adams’s Lameness in Horses. 5th edn. Philadelphia, PA: Lippincott Williams & Wilkins, pp.1110–1113.
Turner, T.A. and Stork, C. (1988) Hoof abnormalities and their relation to lameness. Proceedings of the American Association of Equine Practitioners, 34, pp.293–297.
Turner, T.A. (1992) The use of hoof measurements for the objective assessment of hoof balance. Proceedings of the American Association of Equine Practitioners, 38, pp.389–395.
Verschooten, F. (1992) Hoof measurement problems. Hoof Care and Lameness Magazine Archives. [Online]. http://www.hoofcare.com/archives/hoof_research.html [Accessed: 23 January 2012]. [Not peer-reviewed; retained for historical context.]
Weller, R., Pfau, T., Verheyen, K., May, S.A. and Wilson, A.M. (2006) The effect of conformation on orthopaedic health and performance in a cohort of National Hunt racehorses: preliminary results. Equine Veterinary Journal, 38(7), pp.622–627. https://doi.org/10.2746/042516406×159034
Wilson, A.M., Seelig, T.J., Shield, R.A. and Silverman, B.W. (1998) The effect of foot imbalance on point of force application in the horse. Equine Veterinary Journal, 30(6), pp.540–545. https://doi.org/10.1111/j.2042-3306.1998.tb04531.x
SUPPLEMENTARY FIGURES
Figures 1–7: Main manuscript figures. Figures A–D: PHVD supplementary analysis. All figures produced at 180 dpi.
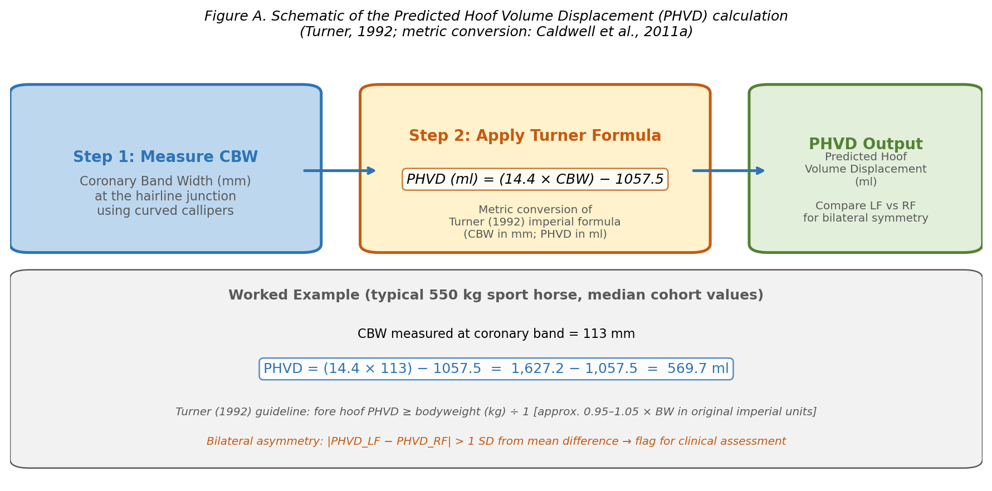
Figure A. Schematic of the PHVD calculation pipeline (Turner, 1992; metric conversion: Caldwell et al., 2011a). Step 1: measure CBW (mm). Step 2: apply PHVD=(14.4×CBW)−1057.5. Worked example: CBW=113 mm → PHVD=569.7 ml.
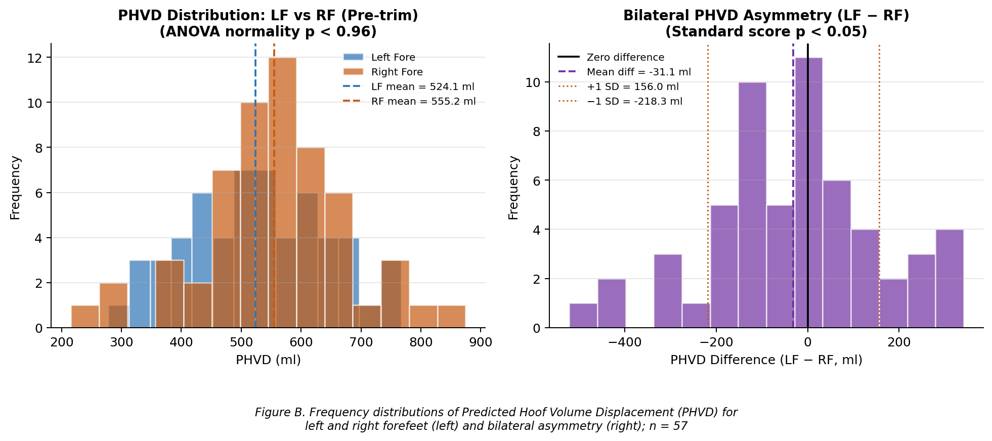
Figure B. PHVD frequency distributions for LF and RF forefeet pre-trim (left; n=57; ANOVA normality p<0.96) and bilateral asymmetry LF−RF (right). Bilateral symmetry confirmed (standard score within ±1 SD; p<0.05).
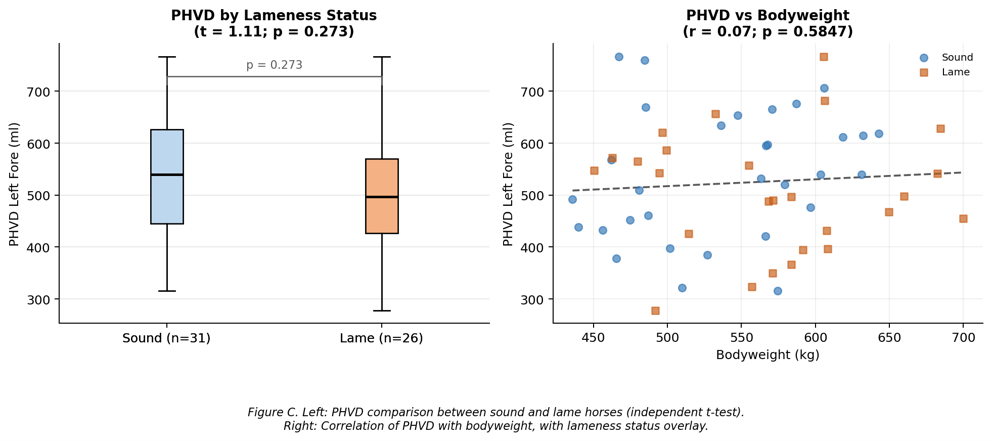
Figure C. Left: PHVD (LF) for sound (n=31) vs lame (n=26) horses; directionally lower in lame horses (t=1.108; p=0.273). Right: PHVD vs bodyweight correlation with lameness status overlay (r=0.07; p=0.585).
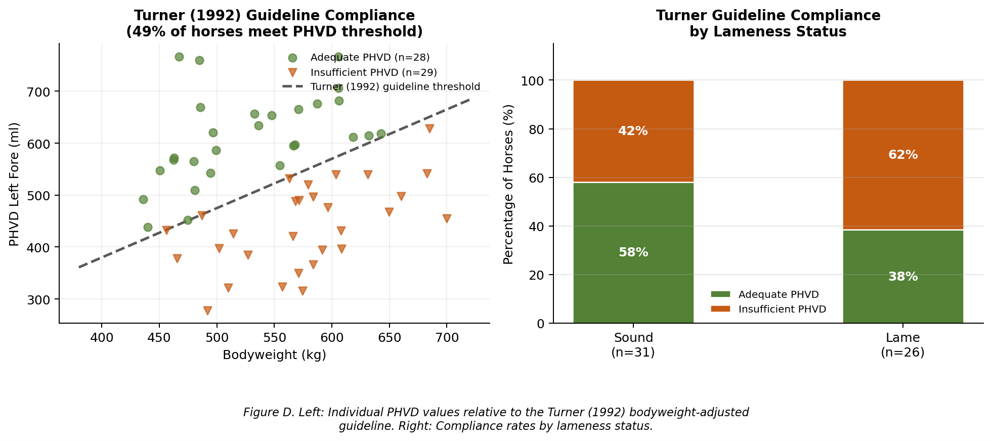
Figure D. Left: Individual PHVD vs bodyweight with Turner (1992) guideline threshold (dashed). Right: Compliance rates by lameness status — sound 58% vs lame 39%, consistent with Turner (1992) hypothesis