
Golden ratio proportions in equine hoof capsule geometry: a comparative analysis of front and hind feet
Mitchel D., Balchin P., Fowler S., Caldwell M. Golden ratio in equine hoof geometry. HoofFlix.com
Keywords: horse; hoof balance; golden ratio; Kepler triangle; dorsopalmar balance
Summary
Background: The golden ratio (phi, approximately 1.618) has been identified in numerous biological structures and is associated with biomechanical efficiency. Anecdotal observations from experienced farriers suggest that equine hooves trimmed to achieve optimal balance exhibit proportional relationships consistent with golden ratio geometry, specifically the Kepler triangle configuration. However, this hypothesis has not been systematically tested using standardised trimming protocols.
Objectives: To test the hypothesis that equine feet trimmed according to a standardised trimming protocol exhibit proportional relationships consistent with the golden ratio and Kepler triangle geometry, and to compare these relationships between front and hind feet.
Study design: Retrospective observational study analysing sagittal section radiographic measurements.
Methods: Sagittal section measurements were obtained from 100 front feet (50 pairs) and 35 hind feet trimmed according to a standardised trimming protocol (Caldwell 2010). Measurements included dorsal wall length, hairline to heel length, bearing border length and hairline angle. Golden-ratio conformity was assessed using a 3:4:5 proportional model derived from Kepler’s triangle geometry. Independent-samples t-tests compared measurements between foot types.
Results: Front feet demonstrated strong conformity to golden ratio proportions with a mean deviation of 0.73 mm (2.9% error) when dividing dorsal wall by 3, hairline to heel by 4 and bearing border by 5. Twenty percent of front feet achieved exactly 90 degrees hairline angle consistent with Kepler triangle formation. Hind feet showed significantly weaker conformity with a mean deviation of 3.10 mm (13.1% error; p<0.0001). Significant differences existed between front and hind feet for hairline to heel length (p<0.0001), bearing border length (p<0.0001) and hairline angle (p<0.0001).
Main limitations: Retrospective design; measurements from cadaver specimens; single trimming protocol assessed; breed and age data limited.
Conclusions: Front feet trimmed to the standardised protocol demonstrate proportional relationships closely approximating golden ratio geometry, supporting the theoretical basis for this approach to hoof balance. The weaker conformity observed in hind feet suggests that different trimming parameters may be required to achieve optimal geometric proportions in hind limbs.
Table 1 presents descriptive statistics for all measurements in front and hind feet. Front feet (n=100) had mean dorsal wall length of 73.37 mm (SD 9.89), mean hairline to heel length of 100.73 mm (SD 13.34), mean bearing border length of 125.23 mm (SD 16.29) and mean hairline angle of 90.64 degrees (SD 2.99). Hind feet (n=35) had mean dorsal wall length of 71.11 mm (SD 7.41), mean hairline to heel length of 82.40 mm (SD 9.25), mean bearing border length of 105.36 mm (SD 12.23) and mean hairline angle of 86.34 degrees (SD 4.01). Figure 5A illustrates these differences graphically.
Measurement | Front feet (n=100) | Hind feet (n=35) |
| Dorsal wall (mm) | 73.37 plus or minus 9.89 (43.68 to 96.77) | 71.11 plus or minus 7.41 (59.03 to 83.42) |
| Hairline to heel (mm) | 100.73 plus or minus 13.34 (53.93 to 129.40) | 82.40 plus or minus 9.25 (68.20 to 100.94) |
| Bearing border (mm) | 125.23 plus or minus 16.29 (66.35 to 156.92) | 105.36 plus or minus 12.23 (84.64 to 130.00) |
| Hairline angle (degrees) | 90.64 plus or minus 2.99 (82.40 to 100.40) | 86.34 plus or minus 4.01 (74.60 to 94.80) |
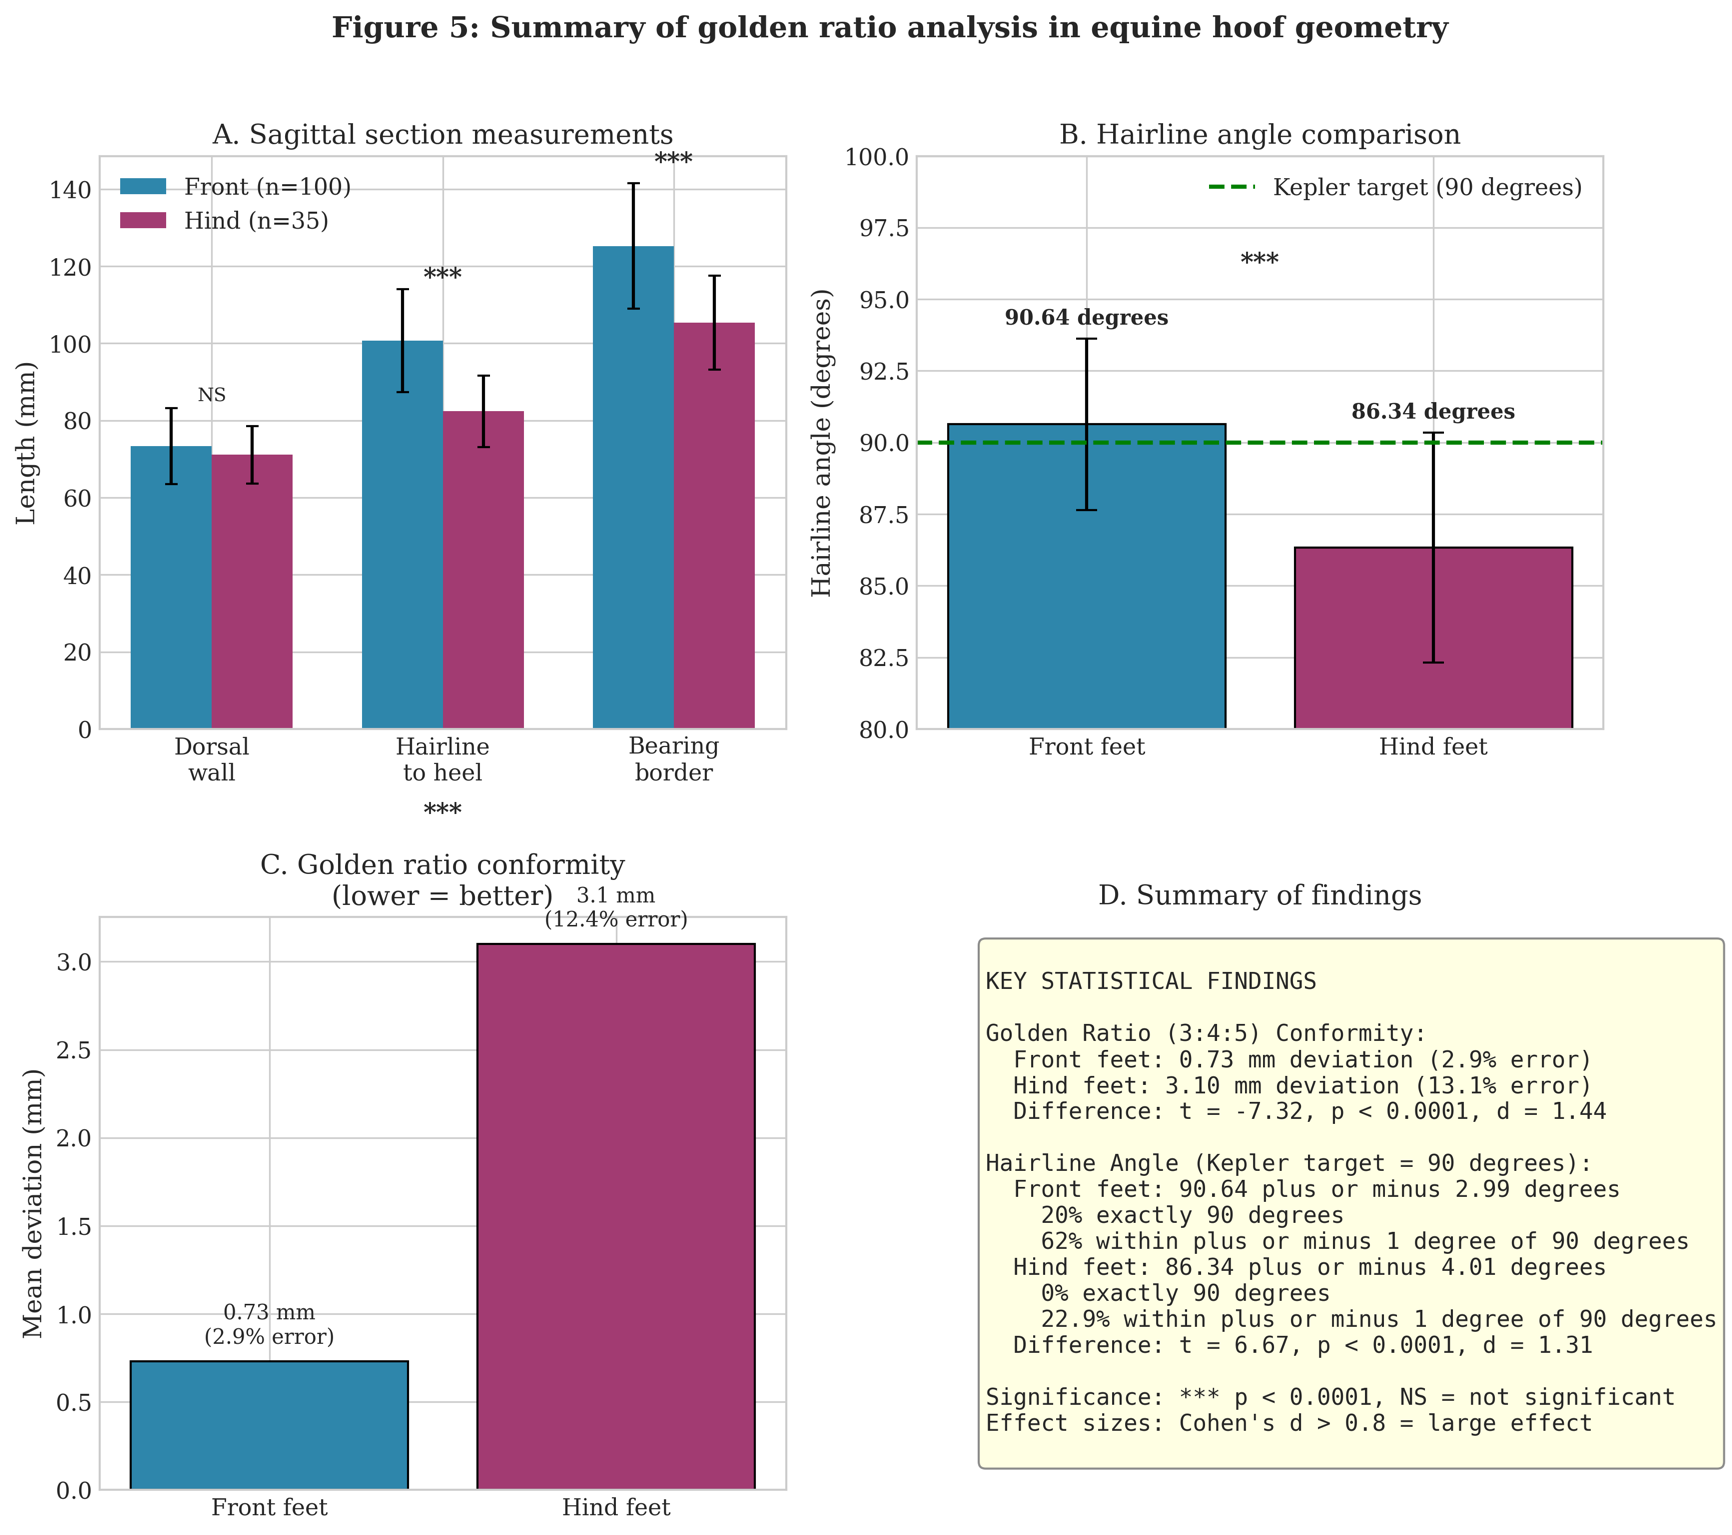
Figure 5: Summary of golden ratio analysis in equine hoof geometry. Four panel figure presenting key findings. Panel A: Comparison of sagittal section measurements between front and hind feet showing significant differences in hairline to heel length and bearing border length (p<0.0001) but not dorsal wall length (NS = not significant). Panel B: Comparison of hairline angles showing front feet approximate the 90 degree Kepler target while hind feet deviate significantly below. Panel C: Golden ratio conformity expressed as mean deviation from perfect proportions, with front feet showing markedly better conformity than hind feet. Panel D: Summary table of key statistical findings including t statistics, p values and effect sizes. Asterisks indicate significance level (*** = p<0.0001).
Table 2 and Figure 1 present the golden ratio analysis results. For front feet, dividing dorsal wall by 3 yielded 24.46 mm, hairline to heel by 4 yielded 25.18 mm and bearing border by 5 yielded 25.05 mm. The mean deviation between these quotients was 0.73 mm, representing 2.9% error from perfect golden ratio conformity. For hind feet, the corresponding values were 23.70 mm, 20.60 mm and 21.07 mm respectively, with mean deviation of 3.10 mm representing 13.1% error (Figure 3).
| Parameter | Front feet | Hind feet | Kepler target |
| DW/3 (mm) | 24.46 | 23.70 | Convergent |
| HTH/4 (mm) | 25.18 | 20.60 | Convergent |
| BB/5 (mm) | 25.05 | 21.07 | Convergent |
| Mean deviation (mm) | 0.73 | 3.10 | 0 |
| Error (%) | 2.9 | 13.1 | 0 |
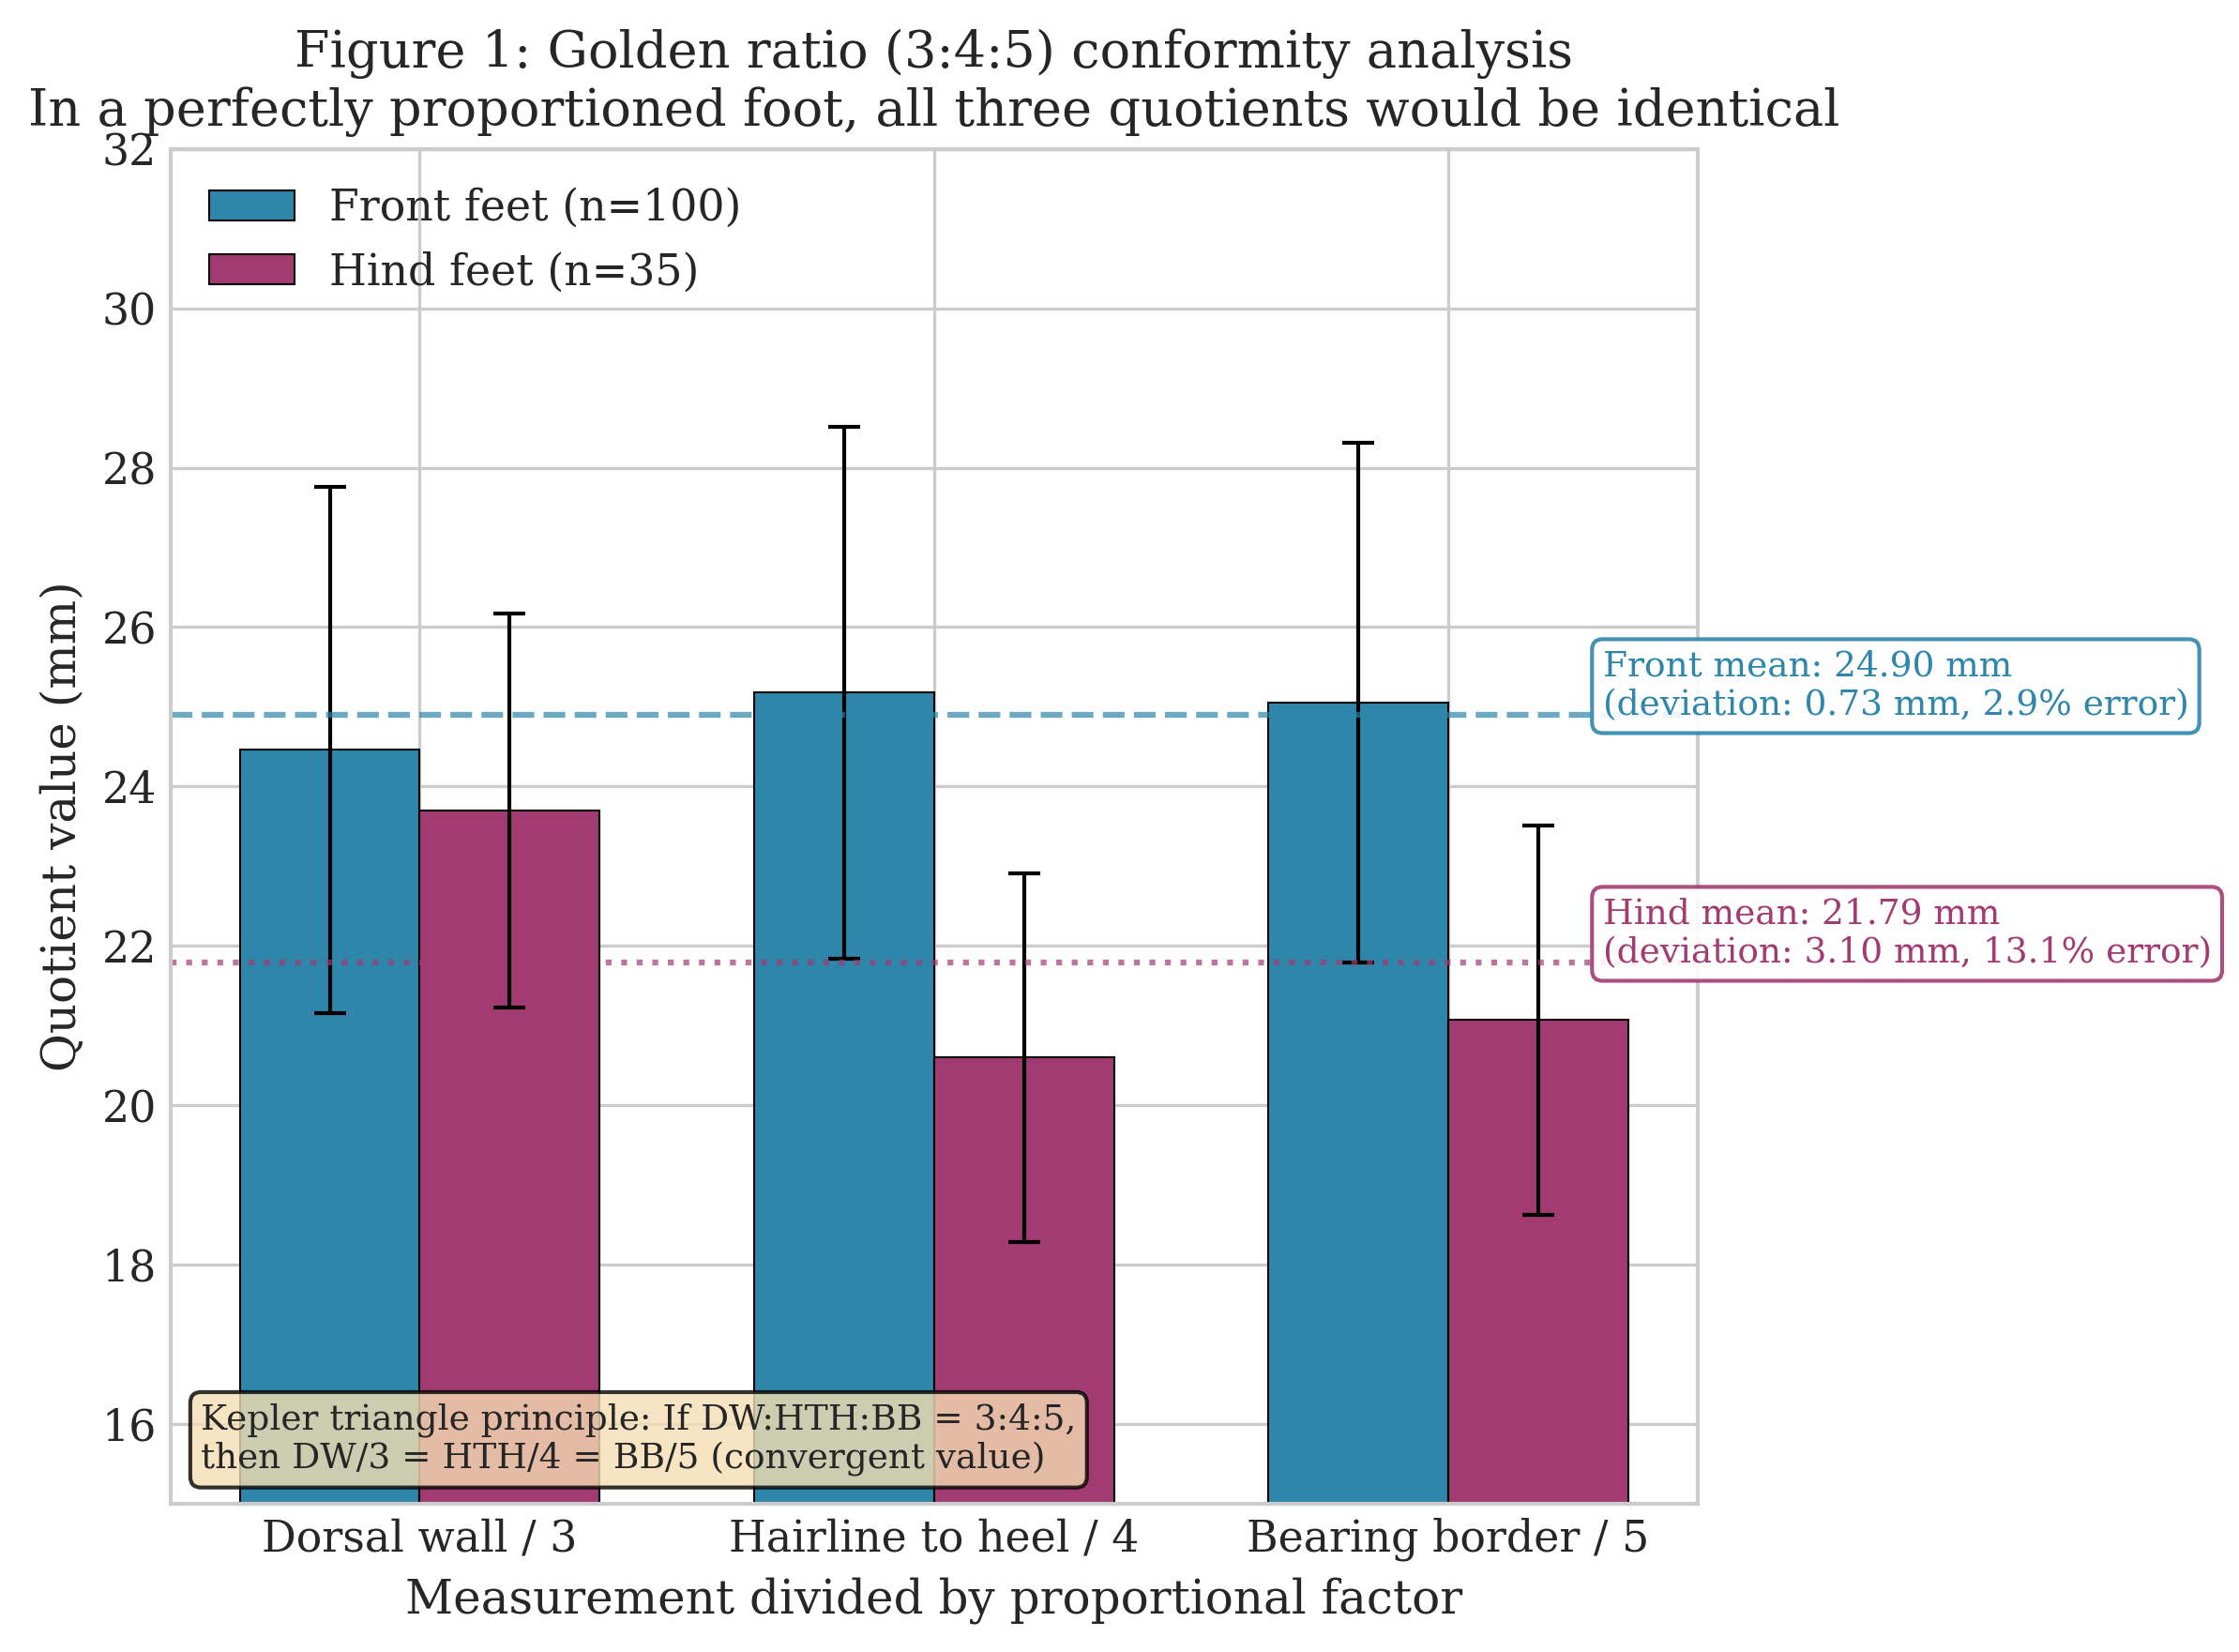
Figure 1: Golden ratio (3:4:5) conformity analysis. Bar chart showing the quotient values obtained by dividing dorsal wall length by 3, hairline to heel length by 4, and bearing border length by 5. In a foot with perfect golden ratio proportions, all three quotients would converge to an identical value. Front feet (blue bars, n=100) demonstrate tight convergence (mean deviation 0.73 mm, 2.9% error) with quotients of 24.46 mm, 25.18 mm and 25.05 mm respectively. Hind feet (red bars, n=35) show greater dispersion (mean deviation 3.10 mm, 13.1% error) with quotients of 23.70 mm, 20.60 mm and 21.07 mm. Horizontal dashed lines indicate the mean convergent value for each foot type. Error bars represent standard deviation.
Hairline angle analysis
Table 3 and Figure 2 present hairline angle analysis results. In front feet, 20 of 100 feet (20%) achieved exactly 90 degrees hairline angle and 62 of 100 feet (62%) were within plus or minus 1 degree of 90 degrees. The mean absolute deviation from 90 degrees was 1.80 degrees. In hind feet, no feet achieved exactly 90 degrees and only 8 of 35 feet (22.9%) were within plus or minus 1 degree of 90 degrees. The mean absolute deviation from 90 degrees was 4.29 degrees. One sample t tests demonstrated that front foot hairline angle was significantly different from 90 degrees (t=2.152, p=0.034) but the deviation was small (mean 90.64 degrees). Hind foot hairline angle was highly significantly different from 90 degrees (t= negative 5.393, p<0.0001; mean 86.34 degrees).
| Parameter | Front feet | Hind feet |
| Mean angle (degrees) | 90.64 plus or minus 2.99 | 86.34 plus or minus 4.01 |
| Feet at exactly 90 degrees | 20 (20.0%) | 0 (0.0%) |
| Feet within plus or minus 1 degree of 90 degrees | 62 (62.0%) | 8 (22.9%) |
| Mean deviation from 90 degrees | 1.80 degrees | 4.29 degrees |
| One sample t vs 90 degrees | t=2.152, p=0.034 | t= negative 5.393, p<0.0001 |
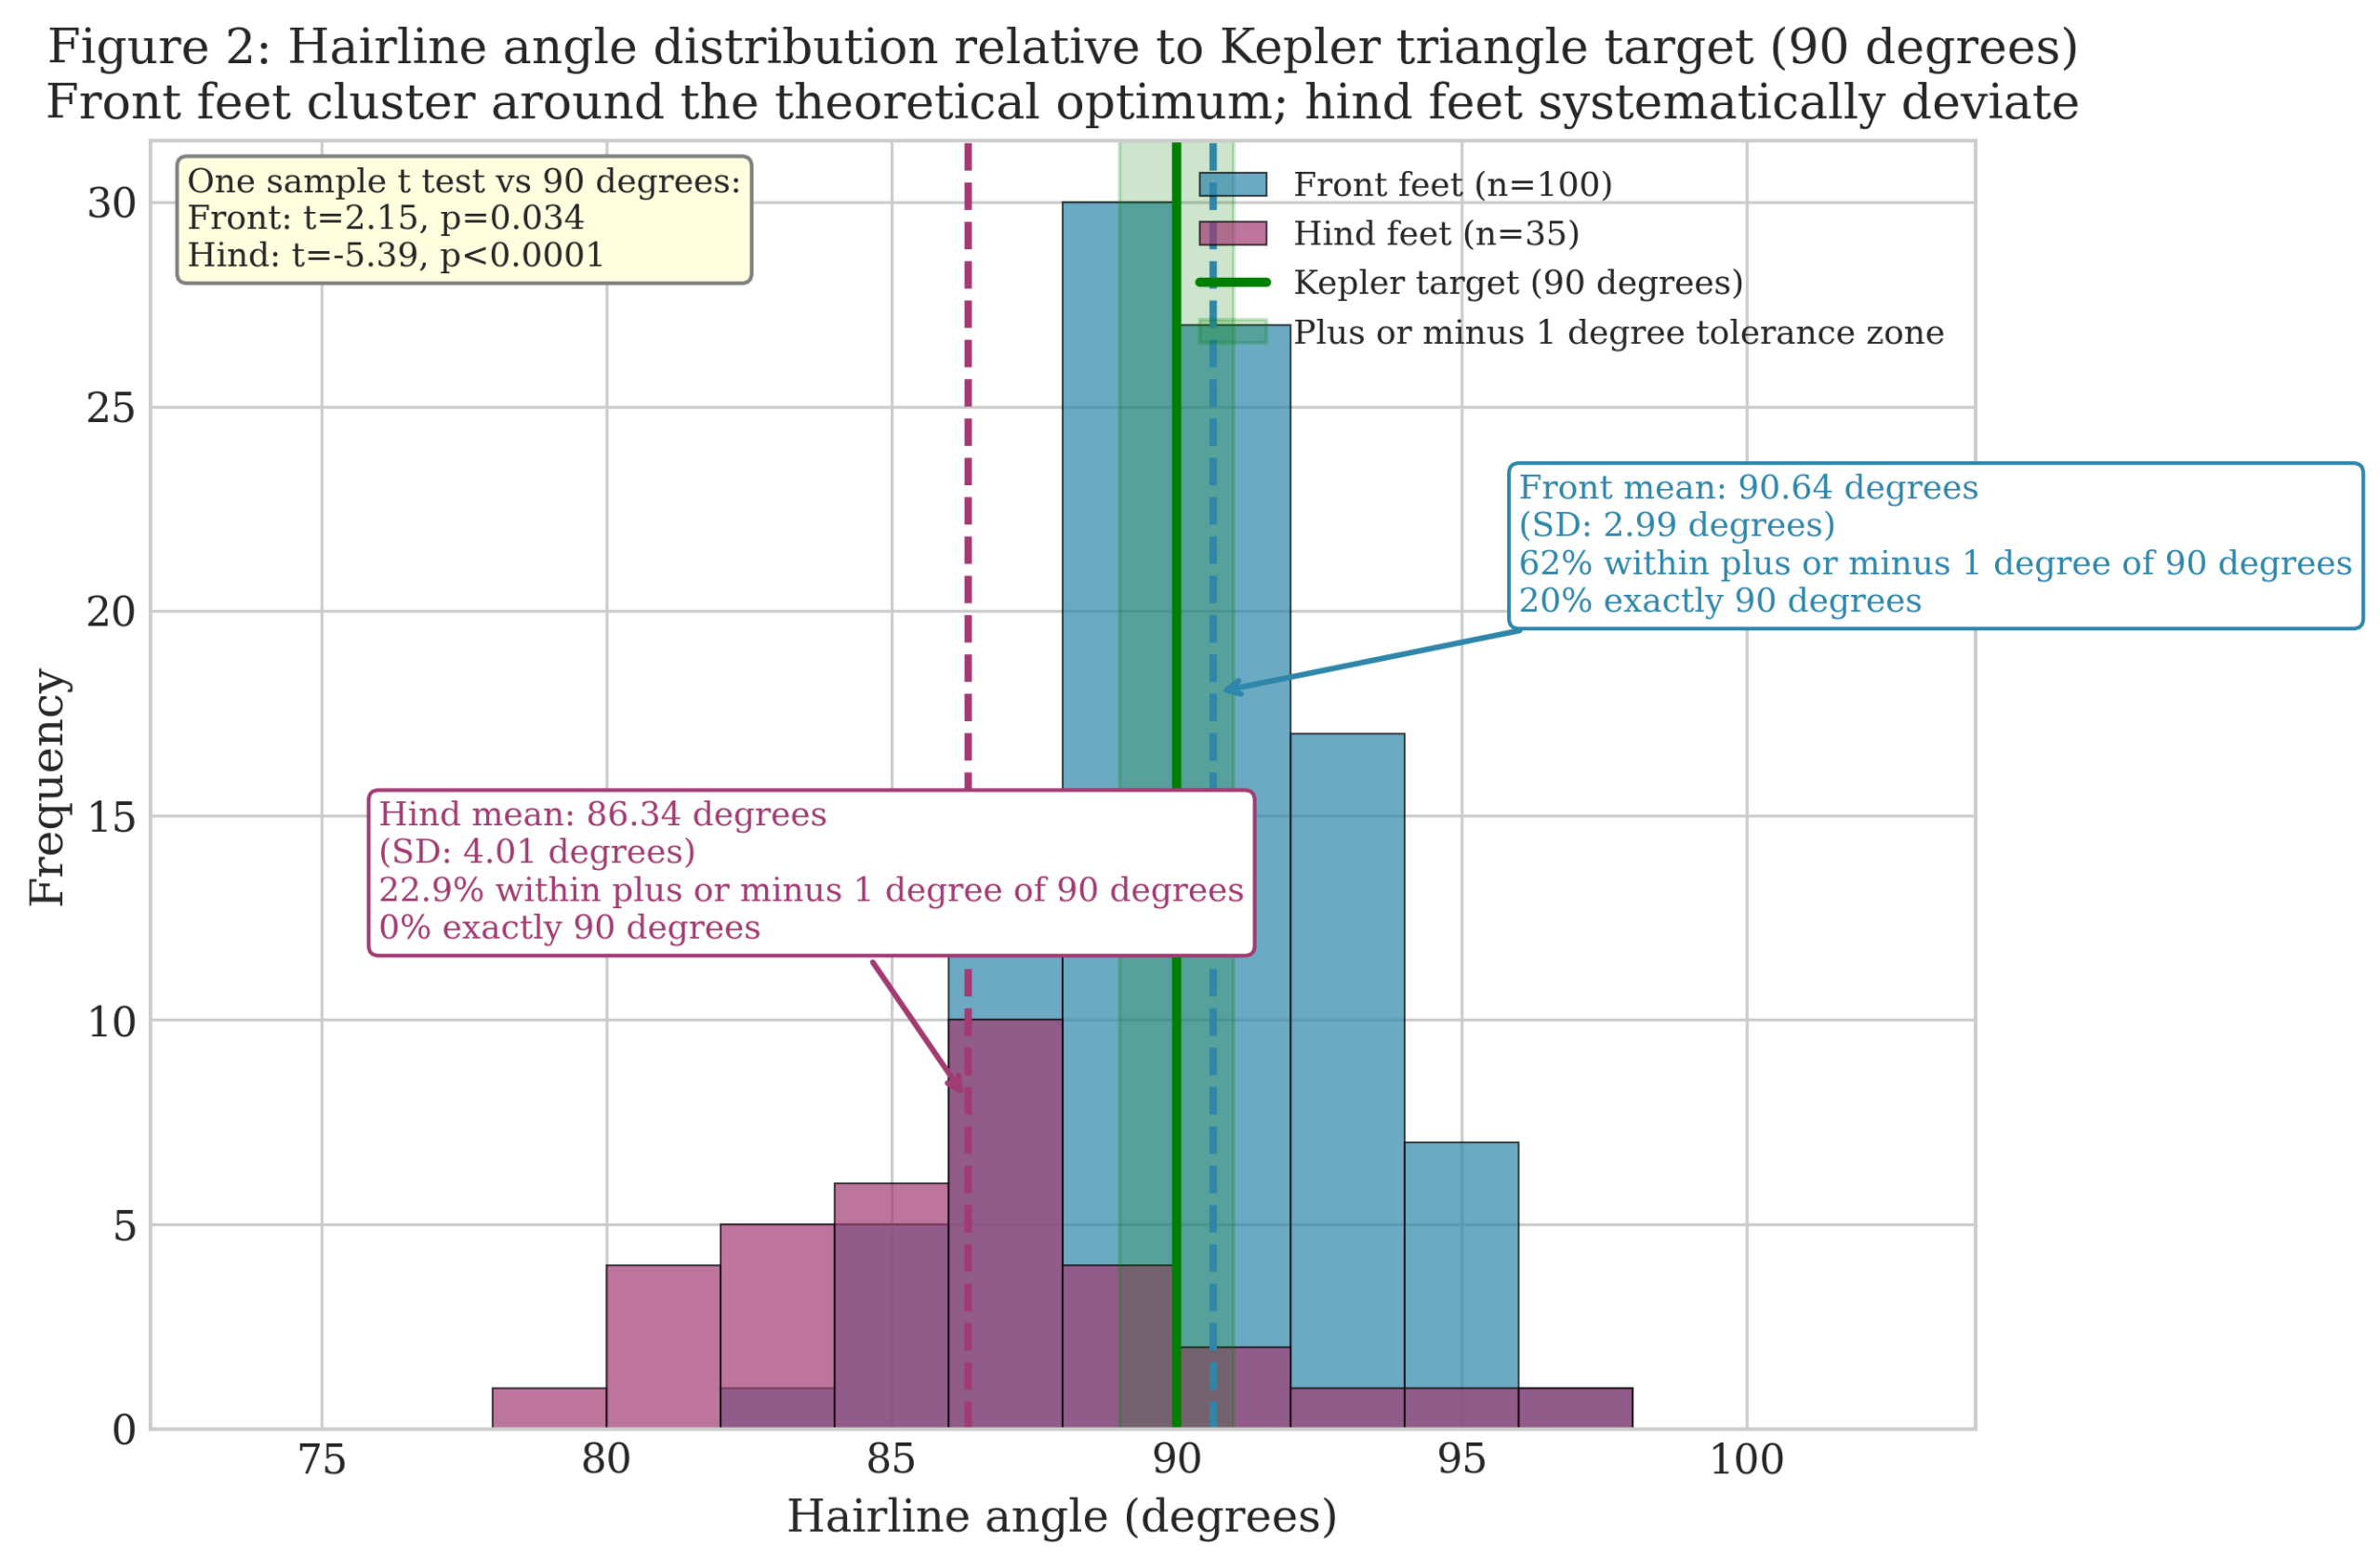
Figure 2: Hairline angle distribution relative to the Kepler triangle target of 90 degrees. Histogram showing the distribution of hairline angles for front feet (blue, n=100) and hind feet (red, n=35). The solid green vertical line indicates the theoretical Kepler triangle target of 90 degrees; the shaded green zone indicates plus or minus 1 degree tolerance. Front feet cluster around the 90 degree target (mean 90.64 degrees, SD 2.99 degrees) with 20% achieving exactly 90 degrees and 62% falling within the tolerance zone. Hind feet show systematic deviation below the target (mean 86.34 degrees, SD 4.01 degrees) with 0% achieving exactly 90 degrees and only 22.9% within the tolerance zone. Statistical annotations show one sample t test results comparing each distribution to the 90 degree target.
Comparisons between front and hind feet
Table 4 presents independent samples t test comparisons between front and hind feet. Dorsal wall length did not differ significantly between foot types (t=1.234, p=0.219, Cohen’s d=0.24). However, hairline to heel length was significantly greater in front feet (t=7.508, p<0.0001, Cohen’s d=1.48), as was bearing border length (t=6.586, p<0.0001, Cohen’s d=1.29). Hairline angle was significantly greater in front feet (t=6.670, p<0.0001, Cohen’s d=1.31). Golden ratio deviation was significantly lower in front feet than hind feet (t= negative 7.319, p<0.0001, Cohen’s d= negative 1.44), indicating better conformity to golden ratio proportions (Figure 3).
| Measurement | t statistic | p value | Cohen’s d | Interpretation |
| Dorsal wall | 1.234 | 0.219 | 0.24 | Not significant |
| Hairline to heel | 7.508 | <0.0001 | 1.48 | Large effect |
| Bearing border | 6.586 | <0.0001 | 1.29 | Large effect |
| Hairline angle | 6.670 | <0.0001 | 1.31 | Large effect |
| GR deviation | negative 7.319 | <0.0001 | negative 1.44 | Large effect |
Ratio analysis
Table 5 and Figure 4 present ratio analysis results normalised to dorsal wall length. Front feet had mean BB/DW ratio of 1.709 (SD 0.088), exceeding the Kepler triangle target of 1.618 by 5.6%. Front feet had mean HTH/DW ratio of 1.376 (SD 0.093), exceeding the Kepler target of 1.272 by 8.2%. Hind feet had mean BB/DW ratio of 1.482 (SD 0.083), falling below the Kepler target by 8.4%. Hind feet had mean HTH/DW ratio of 1.160 (SD 0.076), falling below the Kepler target by 8.8%.
| Ratio | Front feet | Hind feet | Kepler target | Front deviation | Hind deviation |
| BB/DW | 1.709 plus or minus 0.088 | 1.482 plus or minus 0.083 | 1.618 (phi) | +5.6% | negative 8.4% |
| HTH/DW | 1.376 plus or minus 0.093 | 1.160 plus or minus 0.076 | 1.272 (sqrt phi) | +8.2% | negative 8.8% |
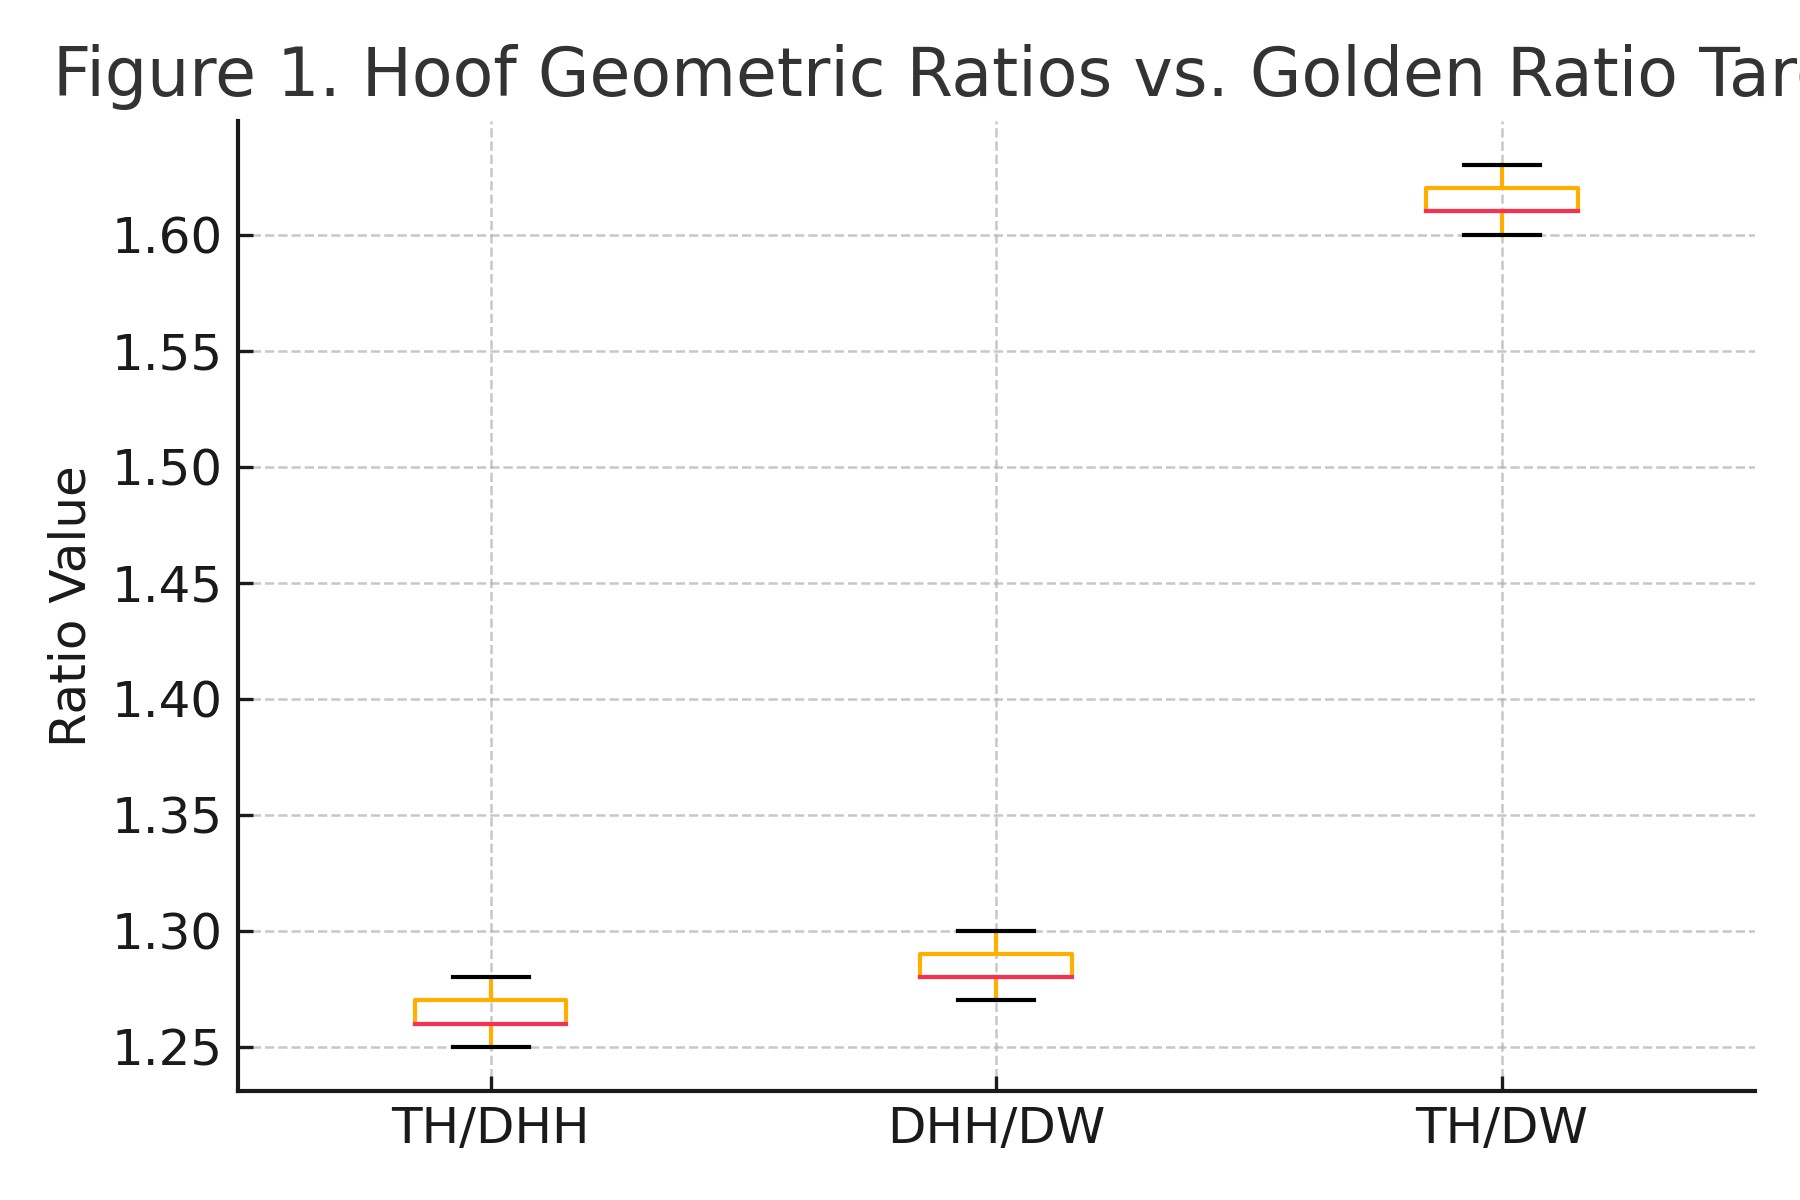
Figure 4: Ratio analysis normalised to dorsal wall length compared with theoretical Kepler triangle proportions. Bar chart comparing bearing border to dorsal wall ratio (BB/DW) and hairline to heel to dorsal wall ratio (HTH/DW) for front feet (blue), hind feet (red) and Kepler triangle targets (green). Kepler targets are phi (1.618) for BB/DW and square root of phi (1.272) for HTH/DW. Front feet exceed both targets (+5.6% and +8.2% respectively), suggesting proportionally longer caudal structures. Hind feet fall below both targets (negative 8.4% and negative 8.8%), suggesting proportionally shorter caudal structures consistent with under trimming at the caudal aspect. Error bars represent standard deviation. Percentage deviations from Kepler targets are annotated above each bar.
Conclusions
Front feet trimmed according to a standardised trimming protocol (Caldwell 2010) demonstrate proportional relationships closely approximating golden ratio geometry, with 20% achieving the 90 degree hairline angle consistent with Kepler triangle formation. These findings support the theoretical basis for this approach to hoof balance and suggest that golden ratio proportions may provide an objective reference framework for assessing dorsopalmar balance. The weaker conformity observed in hind feet indicates that different trimming parameters may be required to achieve optimal geometric proportions in hind limbs, supporting the need for limb specific approaches to hoof care.
References
Balch, O., White, K. and Butler, D. (1993) How lameness is associated with selected aspects of hoof imbalance. Proceedings of the American Association of Equine Practitioners 39, 213-214.
Caldwell, M.N., Allan, L.A., Pinchbeck, G.L., Clegg, P.D., Kissick, K.E. and Milner, P.I. (2016) A test of the universal applicability of a commonly used principle of hoof balance. Veterinary Journal 208, 52-57.
Caldwell, M.N. (2017) An investigation into the use of hoof balance metrics to test the reliability of a commonly used foot trimming protocol and their association with biomechanics and pathologies of the equine digit. PhD Thesis, University of Liverpool.
Clements, P.E., Handel, I., McKane, S.A. and Coomer, R.P. (2020) An investigation into the association between plantar distal phalanx angle and hindlimb lameness in a UK population of horses. Equine Veterinary Education 32(S10), 52-59.
Dyson, S.J., Tranquille, C.A., Collins, S.N., Parkin, T.D.H. and Murray, R.C. (2011) External characteristics of the lateral aspect of the hoof differ between non lame and lame horses. Veterinary Journal 190, 364-371.
Eliashar, E. (2012) The biomechanics of the equine foot as it pertains to farriery. Veterinary Clinics of North America: Equine Practice 28, 283-291.
Faramarzi, B., Langlois, B. and Bhatti, S. (2018) Effect of hoof trimming on gait parameters in horses. Equine Veterinary Journal 50(S52), 18.
Iosa, M., Fusco, A., Marchetti, F., Morone, G., Caltagirone, C., Paolucci, S. and Peppe, A. (2013) The golden ratio of gait harmony: repetitive proportions of repetitive gait phases. BioMed Research International 2013, 918642.
Kane, A.J., Stover, S.M., Gardner, I.A., Bock, K.B., Case, J.T., Johnson, B.J., Anderson, M.L., Barr, B.C., Daft, B.M., Kinde, H., Larochelle, D., Moore, J., Mysore, J., Stoltz, J., Woods, L., Read, D.H. and Ardans, A.A. (1998) Hoof size, shape and balance as possible risk factors for catastrophic musculoskeletal injury of Thoroughbred racehorses. American Journal of Veterinary Research 59, 1545-1552.
Kummer, M., Geyer, H., Imboden, I., Auer, J. and Lischer, C. (2006) The effect of hoof trimming on radiographic measurements of the front feet of normal Warmblood horses. Veterinary Journal 172, 58-66.
Mansmann, R.A., James, S., Blikslager, A.T. and vom Orde, K. (2010) Long toes in the hind feet and pain in the gluteal region: an observational study of 77 horses. Journal of Equine Veterinary Science 30, 720-726.
O’Grady, S.E. and Poupard, D.A. (2003) Proper physiologic horseshoeing. Veterinary Clinics of North America: Equine Practice 19, 333-351.
Osbourne, S.A., Caldwell, M.N., Senior, J.M. and Sherlock, C.E. (2021) Retrospective analysis of foot radiographic measurements in horses with and without navicular syndrome. Equine Veterinary Journal 53, 1039-1048.
Pezzanite, L., Bass, L., Kawcak, C., Goodrich, L. and Moorman, V. (2019) The relationship between sagittal hoof conformation and hindlimb lameness in the horse. Equine Veterinary Journal 51, 464-469.
Ruff, K.L., Holbrook, T.C., Gilliam, L.L., Schramme, M.C. and Back, W. (2016) Radiographic characterization of the hoof in American Quarter Horses with and without acute navicular syndrome. Journal of the American Veterinary Medical Association 249, 1180-1190.
Snow, V.E. and Birdsall, D.P. (1990) Specific parameters used to evaluate hoof balance and support. Proceedings of the American Association of Equine Practitioners 36, 299-311.
Turner, T.A. (1992) The use of hoof measurements for the objective assessment of hoof balance. Proceedings of the American Association of Equine Practitioners 38, 389-395.
van Heel, M.C.V., Barneveld, A., van Weeren, P.R. and Back, W. (2004) Dynamic pressure measurements for the detailed study of hoof balance: the effect of trimming. Equine Veterinary Journal 36, 778-782.
van Heel, M.C.V., van Weeren, P.R. and Back, W. (2005) Changes in location of centre of pressure and hoof unrollment pattern in relation to an 8 week shoeing interval in the horse. Equine Veterinary Journal 37, 536-540.
Waguespack, R.W. and Hanson, R.R. (2010) Navicular syndrome in equine patients: anatomy, causes and diagnosis. Compendium: Continuing Education for Veterinarians 32, E1-E12.
Waguespack, R.W. and Hanson, R.R. (2011) Treating navicular syndrome in equine patients. Compendium: Continuing Education for Veterinarians 33, E1-E5.