
An assessment of conformational traits in newborn foals with digital hyperextension conformation
James Hines BSc (Hons), Dip.WCF., Mark Caldwell PhD; FWCF¹.
¹Scientific Horseshoeing, 116, Newcastle Road, Talke, Staffordshire. ST71SA. UK. Phone: +44 (0) 7792374551 Email: info@hoofflix.com
Key words; foal, neonatal, flexural deformity, developmental
Abstract
Introduction. Digital hyperextension conformation seems to be a term used to incorporate many severities of the condition. The condition is usually a defect of the foal that affects both hind limbs. According to Wilsher (2012), a survey illustrated that of 668 foals that died due to complications at birth, flexural deformity was the most common congenital abnormality diagnosed. To this researcher’s knowledge there is currently no scientific protocol available to identify digital hyperextension ‘flaccid tendons’ in foals and no evidence-based rationale for its early management. Professionals must therefore rely largely on clinical experience (Santschi 2006).
Study design. A pilot comparative study, consisting of collecting and comparing measurement data between 2 groups of subjects with conformational differences.
Aims: To collect quantitative evidence and compare the body segment lengths to test the hypothesis. The hypothesis was to establish if the tibia is longer in a foal that demonstrates the digital hyperextension conformation.
Materials and methods. 16 foals divided into 2 study groups of 8 were used in the study. The groups were separated into Group 1, digital hyperextension foals and Group 2, non-digital hyperextension foals. All the foals were under 1 week of age and all were warm bloods. A standardised measuring stick was used to measure body segment lengths of all subjects in cm. The data was then entered into a data sheet (Fig 3.2). The data was then subsequently entered into a spread sheet using Microsoft Excel 2010Ò and then transferred to Minitab 16© for statistical analysis. Significance was tested at p<0.05.
Results. The results were analysed using a paired t test and Pearson correlations ANOVA. It was found that there was a significant difference in gaskin length between both groups, mean -2.4cm ± 0.9 cm p=0.020. The results also showed a significant difference between body lengths of both groups, mean group 1, 1.5cm ± 0.6cm and group 2, 2.3cm ± 0.8cm p=0.016. There were also significant differences between the forearm lengths of both groups, group 1 (DHS) mean -2.63 cm ± 0.88cm p=0.013.
Conclusion. Whilst from this study it cannot be concluded that muscle/tendon weaknesses are not critical factors, what has been highlighted is that skeletal development, particularly body size in relationship to the radius and tibia, are critical factors of development of the pathological pathway.
Significance. This study demonstrated that there could be other reasons for a foal exhibiting a hyper extended conformation and this may lead to more accurate treatment plans that minimise the need for euthanasia. The continuation of measurements over time could be implemented to create a baseline for foal conformation and build a foal development database.
Introduction
There is currently no scientific protocol available to identify digital hyperextension, flaccid tendons, in foals and no evidence-based rationale for its early management. The amount of information available on digital hyperextension in the newborn foal is limited and largely anecdotal and empirical in nature. Professionals must therefore rely largely on clinical experience (Santschi 2006). Digital hyperextension is a common condition (Wilsher 2012) and the authors developed an interest in this phenomenon through clinical experience however the lack of data on this condition has proved frustrating. This researcher feels there is a proven need for a detailed study into the pathogenesis and treatment management of this debilitating condition. According to Wilsher (2012), a survey illustrated that of 668 foals that died due to complications at birth, flexural deformity was the most common congenital abnormality diagnosed.
General anatomy is well documented (Stashak 2004) and the researcher will not go into depth here other than to concentrate on specific aspects of gross anatomy of the pelvic limb likely to be affected in cases of digital hyperextension. The skeleton is the framework of hard structures that supports and protects the soft tissues of the horse. This study focuses on the development of the pelvic limb.
The foal presents a dynamic, constantly evolving model due to its growth and therefore should not be judged in the same way as an adult horse is appraised (Castelijns 2001). However, except for the assessment criteria for the head and neck area, there is little in the way of published guidelines for the assessment of foal conformation. Digital hyperextension (McKinnon et al 2011 commonly affects both hind limbs. It has been described as a defect that tends to self-correct within days with moderate exercise without the need for treatment. It is, however, the author’s experience that is not that rare to observe 4- to 6-week-olds who are still lifting the toes off the ground when loading the limb. For clarity the authors classify cases of digital hyperextension into 4 grades (Table 1), based on presentation and in addition to severity of symptoms and associated pathologies (figure 1).
Table 1 grading criteria based on clinical symptoms used by the authors to grade cases of digital hyperextension
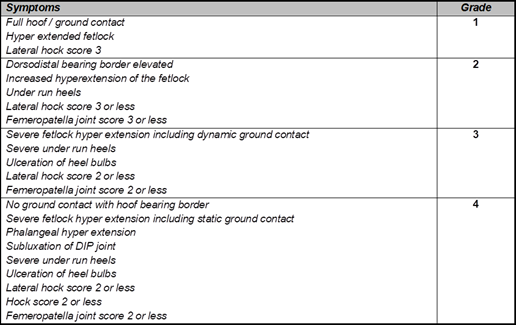
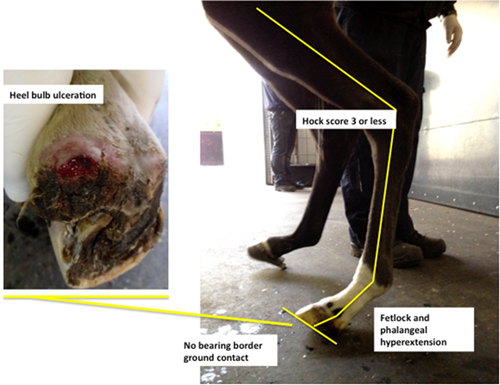
Figure 1 examples of classifications used by the authors to describe digital hyperextension syndrome grade 3.
According to Clayton and Back (2013), the hind limbs carry around 43% of the body mass and this allows for a lower vertical ground reaction force and vertical impulse. The design of the hind limb angulation of the tarsal, stifle and hip allow for greater propulsion unlike the forelimbs that have a more supporting role (Clayton and Back 2013). The lengths of the bones and the angels between them determine limb conformation and affect leverage during locomotion. The reciprocal hind limb apparatus is responsible for passively stabilising the hind limb during the standing position and is considered an important factor in the control of muscle fatigue in horses that do not display digital hyperextension. The tendons and muscles that form most of the reciprocal apparatus are the peroneus tertius, which controls flexion of the hock along with the superficial digital flexor muscle. The superficial digital flexor is responsible for stabilising the tarsus, this is achieved by the fibulas tertius extending from the femur to the lateral tarsus and proximal metatarsus while the superficial digital flexor extends from the femur to the calcaneal tuber. It is the deep and superficial flexors, which are said to be weak in cases of digital hyperextension. The authors question the concept of weakness in the flexor unit, as previously stated, tendons have elastomeric properties. In those cases of digital hyperextension where palmer plantar support has been implemented in treatment, the reported high incidence of the success would indicate that the flexor tendons have not reached their limit of elasticity and that contrary to being weak, they would appear to just be under a greater magnitude of strain from some other, as of yet unknown, factor.
Digital hyperextension in its mildest form, is described as flaccidity or weakness of the flexor tendons and it is a common condition in the newborn foals (Stashak 2002). It is thought that the main cause of digital hyperextension arises from weak flexor tendons (O’Grady 2008, Turner 2013,). The flaccid tendon condition often tends to self-correct within a few days, but it is not uncommon to see a foal with hyperextension at 4 weeks of age (O’Grady 2008, Turner 2013). The observations of O’Grady (2008) and Turner (2013) suggested that there is a possibility of a second form of flaccid tendons. Both authors have claimed to see foals recover from flaccid tendons and foals that have still not recovered after many weeks of being diagnosed with tendon flaccidity. It is our belief that there is a second form of the so-called digital hyperextension condition linked to skeletal development which may explain why several cases fail to make a full recovery occasionally resulting in euthanasia.
In a comprehensive study of 8 cases born with multiple flexural deformities performed immediately post-natal, Wilshire et al (2012) examined the placenta and the linear dimensions of foals including body segment lengths. The researcher noted a significant shortening of the placentae and major blood vessel oedema was present. They also noted that flexural deformity was the most common congenital anomaly displayed by newborn foals and were typified by varying degrees of persistent hyper flexion / extension of the fetlock joints or the carpus, tarsus and other joints of the lower legs. Citing Platt’s (1979) comprehensive survey of perinatal mortality and disorders in Thoroughbred (TB) foals conducted over 6 foaling seasons, they reported an incidence of 17.5 flexural deformities per 1000 births and noted that 121 of 608 (20%) foetuses and newborn foals submitted for necropsy were afflicted with this problem. Wilshire (2012) added that to date the aetiology and pathogenesis of the condition remains unknown, although flexural deformities are congenital rather than hereditary and no sex bias has been reported. Wilshire’s (2012) study was restricted to case selection based purely on the placentae being available and, hence, is likely to be biased to more severe cases of congenital flexural limb deformities. Even though they reported a strong relationship between this condition in newborn foals and reduced dimensions particularly in the body, the results however, were unable to confirm the origin or aetiology of congenital flexural deformities in newborn foals. The researchers also concluded that a genetic component was not immediately apparent even when previously mated to the same stallion. Wilshire et al (2012) did note that their results contradicted those of a previous study by Platt (1979) who recorded that foals with congenital flexural deformities tended to be of above average weight (54.4 ± 7.4 kg), implying a degree of foetal oversize as a contributory role in the condition, but half of Wilshire’s (2012) sample was described as impoverished, implying the opposite. The authors’ own experience suggests that this may be coincidental.
Santschi (2006) studied the development of the conformation of the carpal and fetlock in the growing foal. 119 Thoroughbred foals were studied within the first month of life and then at 30-day intervals until at least age 120 days. Conformation grades were reported for 5 age groups with the first age group being at 7 days. Visual conformation assessment examinations recorded the conformation of the carpus and metacarpophalangeal joint, fetlock, of the forelimbs which were only assessed from a frontal view
The conformation of a foal rapidly changes from birth. Stanshi (2006) stated that only 67 foals from the 119 foals that had been in the study had been measured within the first week. That means that 52 foals had been assessed outside of the 1-week time frame. Immediately post-natal foals struggle to remain stable on their feet; this is mainly due to muscular weakness. It is important to the prospect of the foal’s survival, that this instability is rapidly overcome. Foals that exhibit even a mild incidence of digital hyperextension take considerably longer to acquire sufficient muscular stability to escape danger, with the muscles and tendons being unable to support the skeletal structure. Given the rate of rapid early bone growth even mild cases of post-natal flexural deformity, can and often contribute to quantifiable conformational defects in adulthood. Given the importance to the foal’s development between day zero and day seven, this researcher had monitored the cases of digital hyperextension from day zero. According to Santschi (2006), foals from the period of birth and up to age 18 months tend to change carpal and fetlock conformation greatly over this period. Whilst it must be said that this study offers much in the way of understanding skeletal development between 0 and 18 months it is restricted to reporting the incidence and severity of angular limb deformities only. The researcher’s make no account of conformation defects resulting from flexural deformities.
Accurate conformational data appears difficult to acquire with numerous authors stating that forelimb distal limb conformation presently defies accurate quantification. Conformation should capture deviations in 3 dimensions, be repeatable and storable. Several investigators have attempted to quantify equine conformation (Magnussen 1985; Mawdsley 1996; Hunt 1999; Anderson and McIlwraith 2004) and have all made progress, but an objective method to describe forelimb conformation that encompasses all aspects of conformation has not been achieved. The current research focused on evaluating conformation measurement data.
Just as there is equilibrium of linear forces, so there is equilibrium of moments. Figure 2 highlights the linear force, the vector F, acting at a right angle to the moment arm (a), in a normal conformation, generates the clockwise moment, it is this that is associated with the toe – off appearance in flaccid tendons. The long extensor tendon (L) in the hind leg and the extensor branches of the suspensory ligament (e) also exert a clockwise moment these clockwise moments are equilibrated by the linear force of the deep digital flexor tendon (DF) acting around the flexor moment arm (b) which generates an equal counterclockwise force. T represents the total linear force of the suspensory ligament plus the superficial and deep flexor tendons. In the situation of a foal, born with digital hyperextension of the hind legs, the cause of this condition is not known. It appears that the tendons lack tensile strength. The situation can correct itself with time in many foals.
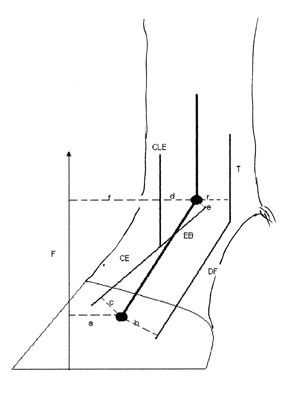
Figure 2 The moments acting on the digit, specifically at the coffin and fetlock joints. (Updated from Rooney 1969)
Aim of the study
The aim of this pilot comparative study was to collect quantitative evidence to test the hypothesis and establish if the tibia is longer in a foal that demonstrates digital hyperextension conformation so that a more precise treatment plan can be established for treating this condition and to establish a deeper understanding of the causes of this debilitating condition. The aim of the study was carried out by using the quantitative paradigm with a true experiment format.
Materials and Methods
The current study was conducted at a professional breeding stable with an onsite private veterinary clinic. The deductive investigation involved collecting and comparing measurement data between 2 groups of subjects. A control group was used, and the subjects were selected for their non-digital hyperextended conformation. The authors hypothesised that a foal exhibiting a digital hyperextended conformation of the hind limb have a longer tibia than that of a foal that exhibits a non-digital hyperextension conformation.
Cohorts
16 foals were divided into 2 study groups, Group 1 and Group 2. Group 1 consisted of 8 foals that were defined as having a non-digital hyperextended conformation. Group 2 consisted of 8 foals that were defined as exhibiting digital hyperextended conformation. All the foals were under 1 week of age and were all warm bloods. All foals were examined by the resident stud veterinary surgeon and the lead researcher at 2 days old, this allowed for a self-correction period usually seen in foals at the early stages of post-natal flexural deformities. Group 1 non-hyperextended group, the limbs exhibited no signs of angular limb deviations or windswept conformation, the fetlock was not hyperextended when viewed while static, the feet of the front and hind limbs presenting flat on the floor from toe to heel at throughout the assessment. Group 2 exhibited digital hyperextension conformation of the hind limb and were categorised according to the grading chart (Table 1).
Data Collection
A standardised measuring stick was adapted to measure in centimetres (cm) was used to measure a range of anatomical reference points by palpation of joints in a such a manner that data collection would not to be influenced by muscle (McIlwraith 2004).
All foals were held by two experienced foal handlers to control and maintain calmness of each foal. The handlers ensured that whilst static both the forelimbs and the hind limbs were together, ensuring the subject present an accurate presentation of the conformation for individual foals. Once satisfied that the position of the subject was in the correct position a custom-made measuring stick was used by the lead researcher to collect the measurement data (table 2). To ensure reliability an assistant checked the measurement data prior to recording. The data for both groups was recorded on an individual assessment form which included a group and foal identification number (Figure 3).
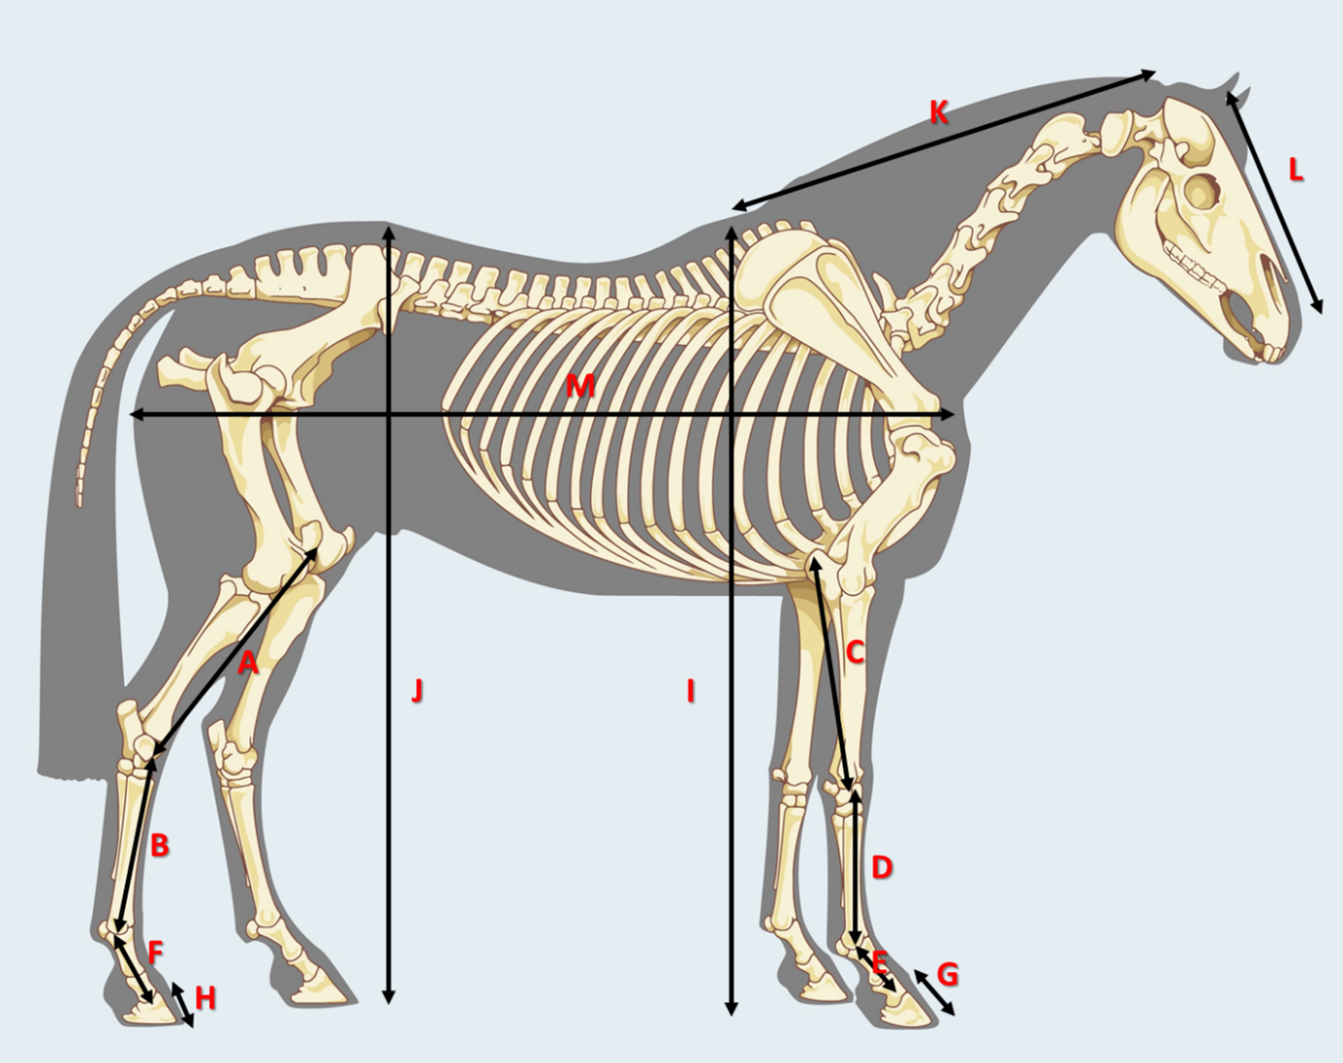
Figure 3 the measured segment body parts, key below

Statistical analysis
Data were recorded to Microsoft excel©. Then transferred to Minitab 16© for statistical analysis. The descriptive data were normalised as a proportion of overall body length were tested using Pearson’s correlations for anatomical segments for both groups and significance between groups was tested using a balanced Anova. Significance was tested at p<0.05.
Results
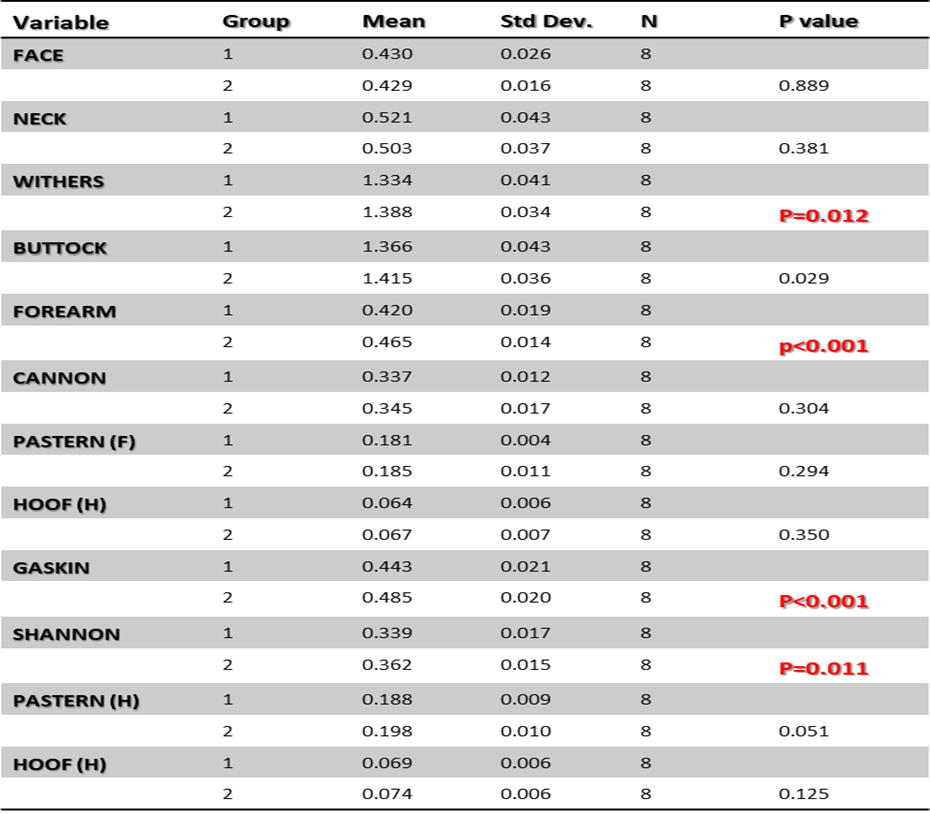
The descriptive data for both groups were normalised as a proportion of overall body length were tested using Pearson’s correlations between anatomical segments. Results demonstrated significant differences between groups as a proportion of body length for the radius, tibia and metatarsal p<0.01 (table 2). The data highlights significant differences in the length of the tibia in group 2 foals exhibiting digital hyperextension compared to those in group 1 (mean -2.4cm ± 0.9 cm p=0.020) (figure 4). The results also demonstrated significant differences between the forearm lengths of both groups, group 2 exhibiting digital hyperextension syndrome (DHS) mean -2.63 cm ± 0.88cm p=0.013. Group 1 foals were shown to have a shorter forearm length than group 2 foals compared to their body length (table 2). When body lengths were compared from both groups of foals (n=8) there were no significant differences in body length between groups, mean difference 1.3cm ± 1.5cm se p=0.17. However, foal number 99338, from group 1was considerably underdeveloped and was removed and the data set re-tested for the significance of body length. The results showed a significant difference between body lengths group 1 =mean 1.5cm ± 0.6cm, group 2 mean 2.3cm ± 0.8cm p=0.016.
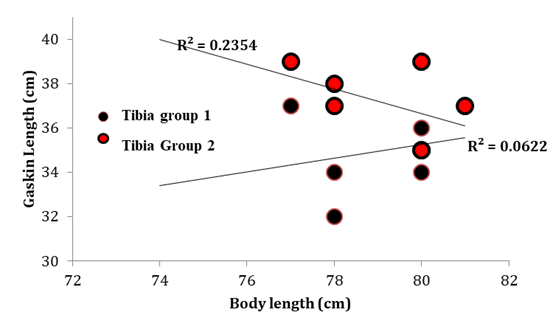
Figure 3 scatter graph comparing tibia ‘gaskin’ lengths between both groups of foals with body length. There was a significant difference in tibial length between both groups (mean -2.4cm ± 0.9 cm p=0.020). Data are displayed in cm n=8 group 1 n=7 group2.
Table 2 descriptive statistics and significance results for body segments as a proportion of body length between cases without (group 1) and with (group 2) digital hyperextension syndrome. Significance was tested at p<0.05
Discussion
It is a commonly held belief within equine professionals that digital hyperextension syndrome is caused by deep digital flexor tendon (DDFT) flaccidity because of a congenital weakness of the deep flexor muscle (DFM). Numerous authors have discussed this pathological pathway (Curtis 2001; Curtis and Greet 2003 and O’Grady 2005) to date but none have furnished evidence-based data. This study provides hitherto unrecorded data on anatomical differences between a cohort of foals exhibiting classic signs of digital hyperextension and a cohort of foals considered normal. Additionally, to the researcher’s knowledge there is little in the way of peer reviewed data quantifying normal conformation in newborn equids. This study provides pilot study evidence for a base line of conformational data in newborn foals in addition to a new grading system, based on clinical severity, for foals exhibiting digital hyperextension syndrome (Table 2).
The objective of the study had been to determine if the tibia bone in the foal is longer in foals that demonstrate a digital hyperextension conformation than that of a foal without a digital hyperextension conformation. This was tested by recording a series of anatomical measurements in relation to overall body length on two separate cohorts of foals between birth and seven days of age. The current study presents new findings and from the results the researcher confirms there were significant differences in both the forearm length mean -4.5% ± 2% SD and gaskin lengths mean 4.2% ± 2.2% SD as a proportion of body length between both groups p<0.05 and accordingly the hypothesis that the tibia is longer in foals that exhibit the digital hyperextension conformation is accepted.
As a result of these findings a mechanical model of a hind limb exhibiting this was designed by the lead author (Hines. J) to demonstrate his phenomena to provide a visual aid when discussing this with fellow farriers and professionals.
The two groups of foals used in this study represented a sample population of warm blood sports horses commercially bred on a single farm. Group 2, n=8 and a control group 1, n=8. The age, exercise pattern and management of both groups of horses were known. Some of the differences in results between the groups may have been influenced by other issues such as conformation of either sire or dam but the sample was considered representative of the normal population of this breed and type encountered in general practice. The value of record keeping is well documented (O’Grady 2005). The stud from which data was collected is the largest of its type in Germany, breeding upwards of 800 foals annually. The stud benefits from an in-house veterinary practice and individual conformation are assessed every 14 days. Detailed assessment data is then upgraded onto a foal’s individual record card. Measurements had been measured by the researcher using a modified measuring stick/tool. It could be argued that the collection of data using digital images may prove more accurate and repeatable. However general conformation studies (Weller 2004) have shown it to be difficult to accurately maintain the position of skin markers. In retrospect it may have been advantages to collect additional data such as weight and chest and hip width. This additional data may have proved helpful in interpreting and understanding the results.
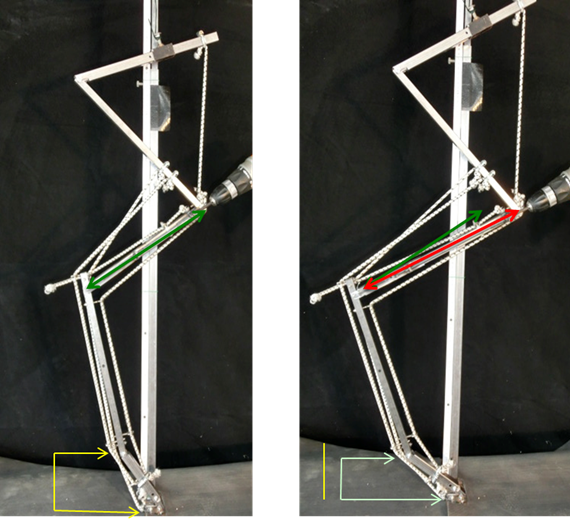
Figure 4 Mechanical models. Image on the left demonstrates a non-hyperextension conformation with the green line representing the length of the tibia and the yellow lines representing the height of the fetlock from the ground surface. Image on the right demonstrates a hyperextension conformation with the red line representing the longer tibia length and the light green lines representing the height of the fetlock from the ground surface.
It commonly stated in farriery and veterinary text that most foals with digital hyperextension auto correct within a short period (Curtis 2001). Considering the results it may have proved useful if follow up data at 28 – 35 days had been recorded. It would be interesting to note if the differences seen in the upper limb measurements, gaskin and forearm, had reduced in those foals that may have auto recovered but no follow up data was available to the researcher. Ideally a power calculation for sample size should have been performed prior to the start of the study. Performing this retrospectively shows a sample size of 20 for this breed and type would be required.
It has been reported by several investigators that digital hyperextension is the result of weak or flaccid tendons / muscles. The results clearly demonstrate an increased length of both forearm and gaskin as a proportion of body length as the only significant factor between groups. These findings suggest a different pathological pathway in that the severity of the clinical appearance could be directly linked to a force overload about the centre of body mass (COM) acting on the extended tibiotarsal and carporadial moment arms (MA). The mean body length was significantly different between groups p<0.05 this suggests a pathway which is initiated by distal displacement of the body COM. Such displacement results in hyper extension of the patella / humerofemeral joint and hyper flexion of the tibiotarsal / radiocarpal joints and hyperextension of the metacarpo / metatarsophalangeal joints. The fact that many foals’ exhibiting digital hyperextension syndrome appears to auto correct (O’Grady 2005) would suggest that the epiphysis of the radius and tibia are restricted under the compression during a period of rapid longitudinal body growth. The resultant postural adaptation places additional bone, tendon and muscle mass palmar / plantar to the distal phalangeal joint within the hoof increasing compressive forces on the angles of the stifle joint and the tarsus. Simultaneously the additional strain appeasers to causes the fetlock to sink and the dorsal hoof wall to rotate dorsoventral.
Although tendon strain was not measured for this study It seems reasonable to assume that tension in the deep digital flexor tendon and deep flexor muscle is significantly reduced when both the radius and tibia are of a proportionate length to the body. This relationship between body size and flexural deformity is partially supported by the findings of Wilshire et al; 2013 who noted significantly reduced morphological changes in the placenta of newborn foals with flexural deformity.
There have been several investigators that have attempted to quantify mature equine conformation (Magnussen 1985; Mawdsley 1996; Hunt 1999; Anderson and McIlwraith 2004). To date no measuring protocol to record foal and particularly limb development has been developed. The lack of any measuring protocol must cast doubt on the conclusions of others (Curtis 2001, O’Grady 2008 and Turner 2013) that are largely anecdotal and empirical in nature. Results from this study have shown and highlighted significant differences in foals that have a digital hyperextension conformation than foals considered to have normal conformation. The researcher suggests that the use of those anatomical measures, previously outlined at strategic points of development time within the foal, may go some way to developing a base line of normal and abnormal juvenile conformation types.
Conclusion and recommendations
Whilst the authors cannot state muscle/tendon weaknesses are not critical factors, what has been indicated, is that skeletal development, particularly body size in relationship to the radius and tibia, may well be critical factors of development for the pathological pathway.
Future Research
Because there is currently no database, a continuation of measurements over time could be implemented to create a baseline for foal conformation and build a foal development database involving both the digital hyperextension and the non-digital hyperextension foals.
With the use of strain gauge technology, the testing of strain on tendons and structures involved, in foals that exhibit different conformations to determine the strain of different muscle and tendons within the hind limb and to better understand the balance of contraction and relaxation during static balance.
A research study into the genetics of foals with flexural conditions could be beneficial in understanding if there could be irregularities in genetic sequences between conformational groups and try to discover why the upper limb segments are longer between conformation groups as a proportional percentage to the of the body length.
Clinical relevance,
These results coupled with the use of the skeletal measurement protocol outlined may help those responsible for management of foal development to improve foal growth and foal management.
Reference list
Anderson, T.M. & McIlwraith, C.W. (2004) ‘Longitudinal development of equine conformation from weanling to age 3 years in the Thoroughbred’, Equine Veterinary Journal. Vol.36, pp 563-570.
Back, W. & Clayton, H. (2013) Equine Locomotion 2nd Edition. London: Saunders Elsevier.
Bernard, W. & Barr, B. (2012), Equine paediatric medicine. London: Manson Publishing Ltd,
Clemente, J. (2011). ‘Evolution of limb bone loading and body size in varanid lizards’, Journal of Experimental Biology Vol. 214, pp 3013-3020
Curtis, S. and Stoneham, S. (1999). ‘Effective farriery treatment of hyperflexion tendons’, Equine Veterinary Education. Vol 11 pp 256-259.
Gunn, H. M. (1995). ‘Relative increase in areas of muscle fibre types in horses during growth’, Equine Veterinary Journal, Suppl. 18 pp 209-213
Castelijns, H. (2001), Farriery in the treatment of flexor deformities and angular limb deviations in the foal, Accessed online (5.7.2014): http://www.mascalcia.net/articoli/a2001_41ab.htm
Hunt, W.F., Thomas, V.G. & Stiefel, W. (1999) ‘Analysis of video-recorded images to determine linear and angular dimensions in the growing horse’, Equine Veterinary Journal. Vol.31, pp 402-410.
Johnston, C. & Back, W. (2006) ‘Hoof ground interaction: when biomechanical stimuli challenge the tissues of the distal limb’, Equine Veterinary Journal. Vol. 38, issue 7, pp 634-641
Kirkendall, D. & Garrett, W. (1997). ‘Function and biomechanics of tendons. Scandinavian Journal of Medicine and Science in Sports. Vol.7, Issue 2, pp 62-6.
Mawdsley, A., Kelly, E.P., Smith, F.H. & Brophy, P.O. (1996) ‘Linear assessment of the Thoroughbred horse: an approach to conformation evaluation’, Equine Veterinary Journal, Vol.28, pp 461-467.
McIlwraith, C.W. (2004). ‘Longitudinal development of the equine conformation from weanling to age 3 years in the thoroughbred’. Equine Veterinary Journal, Vol. 36 issue 7, pp 563-570.
Piróg, A. & Briggs, D. (2010), ‘Skeletal Dysplasia Associated with Mild Myopathy—A Clinical and Molecular Review’, Journal of Biomedicine and Biotechnology,
Platt, H. (1973) ‘Aetiological aspects of perinatal mortality in the Thoroughbred’, Equine Veterinary Journal. Vol.5, pp 116–120.
Rooney, J.R. (1969) Consequent or Secondary Lameness. Accessed online (3.3.2014) http://www.horseshoes.com/farrierssites/sites/rooney/consequentorsecondarylamen ess/consequentorsecondarylameness.htm
O’Grady, S. (2008) online: http;//equinepodiatry.com/article_young_horse_farriery.htm
Santshi, E. M. (2006) ‘Carpal and fetlock conformation of the juvenile Thoroughbred from birth to yearling auction age’, Equine Veterinary Journal Vol.38 Issue 7 pp 604-609
Stashak S.T (Ed) (2011) Adams lameness in Horses 6th Edition, Chichester: John Wiley & Sons.
Turner, T. (2013) Getting started on the right foot. Accessed Online (6.2.2014) http;//fvmace.org/2013 equine foot symposium.
Van den, Hoogen, B.M. Van den Lest, C.H.A. Van den, Weeren, P.R. Van Golde, L.M.G. Barneveld, A. (1999). ‘Changes in proteoglycan metabolism in osteo-chondritic articular cartilage of growing foals. Equine Veterinary Journal, Vol. 31 pp 38-44.
Van den, Hoogen, B.M. Van den Lest, C.H.A. Van den, Weeren, P.R. Van Golde, L.M.G. Barneveld, A. (1999). ‘Effect of exercise on the proteoglycan metabolism of articular cartilage in growing foals. Equine Veterinary Journal, Vol. 31 pp62-66.
Wilsher, S. Ousey, J & Allen, W.R. (2012) ‘Observations on the placentae of eight Thoroughbred foals born with flexural limb deformities. Equine veterinary education, Vol. 25, issue 2, pp 84-95.